
A closer look - PowerPoint PPT Presentation
1 / 186
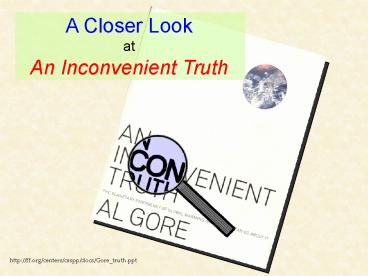
Title: A closer look
1
A Closer Look at An Inconvenient Truth
http//ff.org/centers/csspp/docs/Gore_truth.ppt
2
Gorewellian Double Speak
Nobody is interested in solutions if they dont
think theres a problem. Given that starting
point, I believe it is appropriate to have an
over-representation of factual solutions on how
dangerous it (global warming) is, as a predicate
for opening up the audience to listen to what the
solutions are, and how hopeful it is that we are
going to solve this crisis
Interview with Grist Magazine
3
In An Inconvenient Truth, Al Gore purposely picks
and chooses the facts he needs to produce a
carefully scripted storyHollywood style. And
when facts are insufficient, he makes things up.
The text and imagery he creates looks good and it
is emotionally stirring, but it is not the Real
Truth. But the images are dire and alarming
only when presented without a context. The Real
Truth is more complex and complicated than the
simplified version that Gore presents. Here, we
illustrate some of the more glaring examples of
Gores fact-crafting that we found while paging
through the book version of An Inconvenient Truth.
4
An Inconvenient Truth
Gore opens his book with an emotional tale,
overlaid on the picture below, about the Apollo 8
astronauts as they became the first humans to
orbit the moon. Gore writes The vessel went
behind the far side of the moon and lost radio
contactit was a time of great suspense. Then, as
radio contact was reestablished, the crew looked
up and saw this spectacular sightWhile the crew
watched the Earth emerging from the dark void of
space, the mission commander, Frank Borman, read
from the book of Genesis In the beginning God
created the Heavens and the Earth. One of the
astronauts aboard, a rookie named Bill Anders,
snapped this picture and it became known as Earth
Rise p. 12-13
5
The Real Truth
Gores emotional moment in time wasnt a moment
in time at all, instead it was constructed from
three different events which took place over a
period of 19 hours. According to the transcripts
of the Apollo 8 mission, available from NASA, the
crew of Apollo 8 orbited the moon a total of 10
times, each time losing radio contact as they
passed behind the moon and reestablishing it as
they emerged. The first time this occurred was
indeed a time of great suspense. After the third
time around, as commander Borman was maneuvering
the craft, the crew spotted the earth emerging
from behind the edge of the moon and snapped
several photographs. On the ninth time around,
the Apollo 8 crew was broadcast on live TV around
the world. They ended the broadcast by each
reading a few lines from Genesis. Bill Anders
(not Frank Borman) began, In the beginning
Eventually, commander Borman read some text and
then signed off with And from the crew of Apollo
8, we close with good night, good luck, a Merry
Christmas and God bless all of you - all of you
on the good Earth. Definitely an emotional
journey, but it did not unfold the way Gore
portrayed it. Instead, he felt it was necessary
to tamper with the facts in order to produce a
story the way he wanted it to be told. This
Hollywood twist is a common manipulation
throughout An Inconvenient Truth.
6
And, while were revealing the Real Truth, Bill
Anders, the rookie astronaut that snapped the
picture, framed it like this
But, to make the scene seem more familiar, in An
Inconvenient Truth, Gore chooses to flip it
around.
7
An Inconvenient Truth
Gore is disingenuous again on the very next page.
This time he is describing the picture below
This is the last picture of our planet taken by
a human being from space. It was taken in
December 1972 during the Apollo 17 missionthe
last Apollo missionfrom a point halfway between
the Earth and the MoonWhat makes this image so
extraordinary is that its the only photo we have
of the Earth from space taken when the Sun was
directly behind the spacecraftFor this reason,
this image has become the most commonly published
photograph in all of history. No other image
comes close. p14-15.
8
The Real Truth
That image was definitely not the last photograph
of Earth taken by a human in space. Literally
hundreds of people that have gone into space
since the last Apollo mission, and still more
that are scheduled to leave on the next Shuttle
mission. Between them, they have taken thousands
of photos. And for Gores contention that What
makes this image so extraordinary is that its
the only photo that we have of the Earth from
space taken when the Sun was directly behind the
spacecraft, below left is another, taken 5 years
earlier from NASA satellite ATS-III. And below
right, is a GOES weather satellite image. These
full-disk GOES images are taken every hour and
have been produced for more than 30 years! And as
far as being the most commonly published
photograph in history by a wide margin, a Google
search of most reproduced photograph
overwhelmingly points to the photo of the flag
being raised over Iwo Jima.
9
An Inconvenient Truth
Gore begins his tale of anthropogenic global
warming with the graph belowthe Mauna Loa
history of the atmospheric carbon dioxide (CO2)
concentration. He writes This is the image that
first caused me to think aboutand then become
intently focused onglobal warming. p 30.
10
The Real Truth Images Gore apparently does not
think about.
A CO2 rise and USA temperature fluctuation
mismatch
Of the total CO2 added to the atmosphere by human
release in the 20th century, only 18 was
contributed up to 1940, and fully 82 thereafter
11
A CO2 rise and USA temperature fluctuation
mismatch
Period of lower human CO2 release
however, USA temperatures were high before 1940
when CO2 levels were lower, and then cooled
through the 1970s when CO2 levels were far higher.
Period of higher human CO2 release
12
The Real Truth (cont.)
Historic CO2 levels and temperature changes are
not well correlated for the entire Northern
Hemisphere either.
13
Gores world upside-down?
Can we demonstrate that greenhouse gas rises
precede temperature rises, thus inferring
temperature as driving CO2 levels?
14
The Real Truth
Can an effect appear before its cause?
Historic CO2 levels follow temperature changes,
not precede them!
Ice core samples indicate there is an average of
400 -1600 years lag of cause after effect.
15
Hypothesis Falsified
16
The Real Truth cont
Also, It is not until more than 150 pages later,
pages 216-217, that Gore presents a graph of the
history of the Earths total human population.
The rise in atmospheric CO2 closely matches the
rise in human population and serves as
illustration that fossil fuels are, far and away,
the most vital energy source that supports the
6.5 billion people of today. In fact, 86.2 of
the worlds energy needs are currently met by
fossil fuels. Nuclear and hydropower supply
another 12.4, and the remainder, 1.4, is made
up by such things as solar, wind, and geothermal.
Total Human Population
17
The Real Truth (cont.)
Throughout An Inconvenient Truth, Gore
sanctimoniously floods us with a litany of his
perceived woes but never once stops to mention
that during the past 100 years, along with rising
CO2 levels, came rising life expectancy. In
fact, by most accounts, the lifespan of the
average human being doubled during the 20th
centuryfrom technological advances made possible
by energy derived from fossil fuels.
Global Average Human Life Expectancy 0 to 2005
A.D.
18
An Inconvenient Truth
Gore presents us with this temperature history
for the past 1,000 years. This is the so-called
hockey stick history which shows about 900
years of little temperature variation and then a
rapid rise, presumably caused by human CO2
emissions, during the past 50-100 years. p 64-65
19
The Real Truth
The hockey stick is not the only reconstructed
temperature history of the past 1,000 years or
so. Another is presented below. This one,
developed by Anders Moberg and colleagues (2005)
depicts the climate of the past 2,000 years as
being much more variable. The warming during the
past 50-100 years appears less unusual against
this climate history.
20
The GRIP (Greenland) borehole record is one of
the best records because it is not a proxy, it is
a DIRECT measure of temperature. Shown are the
last 2000 years. (Dahl-Jensen et al. 1998,
Science, 282, 268-271 "Past Temperatures Directly
the Greenland Ice Sheet"). A similar
reconstruction occurs for the Ural Mountain
borehole temperatures (i.e. warmer 1000 years
ago, Bemeshko, D., V.A. Schapov, Global and
Planetary Change, 2001.
21
Data like those from the Sargasso Sea show higher
temperatures changes long before the modern era
long before human CO2 emissions
22
Is the problem of climate change--ostensibly an
adverse tradeoff of the use of fossil fuels to
power the prodigious and salutary economic growth
of modern civilization--really the moral
equivalent of Nazi and Communist malevolence and
hatred? Is ExxonMobil or Arch Coal really
motivated by a loathing of nature or mankind? Are
dissenting scientists like MITs Richard Lindzen
morally comparable to Nazi appeasers?
23
Weckstrom et al.'s data indicate that the peak
warmth of the AD 1200-1300 termination phase of
the MWP was about 0.15C warmer than the peak
warmth of the post-1920 period. Even more
interesting, the peak warmth of the AD 1380-1550
period was warmer still, at 0.25C above the peak
warmth of the post-1920 period.
Weckstrom, J., Korhola, A., Erasto, P. and
Holmstrom, L. 2006. Temperature patterns over the
past eight centuries in Northern Fennoscandia
inferred from sedimentary diatoms. Quaternary
Research 66 78-86.
24
An Inconvenient Truth
adapted from p. 67
And within 45 years, this is where the CO2
equivalent levels will be if we do not make
dramatic changes quickly. There is not a single
part of this graphno fact, date, or numberthat
is controversial in any way or in dispute by
anybody. To the extent that there is a
controversy at all, it is that a few people in
some of the less responsible coal, oil, and
utility companies say, so what? Thats not going
to be any problem. But if we allow this to
happen, it would be deeply and unforgivably
immoral. It would condemn coming generations to a
catastrophically diminished future.
600
Heres where CO2 is nowway above anything
measured in the prior 650,000 year record.
400
300
CO2 Concentration
260
240
200
CO2 (ppm)
Temperature (ºF)
25
The Real Truth
According to the 2001 Third Assessment Report of
the United Nations Intergovernmental Panel on
Climate Change (hardly less responsible
industry representatives) there is a wide range
of possibilities as to the atmospheric carbon
dioxide (CO2) concentration in the next 45 years.
And, by the year 2050, not a single one has a CO2
concentration that exceeds 600ppmthe number that
Gore presents in his graphic he describes as not
being controversial in any way or in dispute by
anybody.
The CO2 projection that Gore claims is not
controversial in any way or in dispute by
anybody.
Projection of future CO2 concentration (from the
IPCC, TAR, 2001, p. 65)
X
26
The Real Truth (cont.)
In order to reach Gores projected level of over
600ppm in the next 45 years, the annual growth
rate of atmospheric CO2 would have to increase at
an accelerating pace that exceeds 1/yr. For the
past 30 years or so, the annual atmospheric CO2
growth rate has averaged around 0.45/yr, or less
than one-half the value Gore incorporates into
his projections. Gore has grossly misrepresented
the Real Truth. If we continue in
business-as-usual, the best estimates of the
atmospheric CO2 concentration by the year 2050 is
464ppmabout 150ppm less than the level Gore
characterizes as not in dispute by anyone.
The CO2 projection based upon established trends.
Projection of future CO2 concentration (from the
IPCC, TAR, 2001, p. 65)
X
27
Kyoto Protocol would avert only 0.06 C of
global warming by 2050
Without Kyoto
With Kyoto
Fully implementing the Kyoto Protocol would not
produce a meaningful abatement of the projected
warming trend. Equivalently, the forecast warming
that would have developed by 2050 occurs by 2053.
Model results are for the UKMO HadCM3 IS92a model
28
An Inconvenient Truth
Pages 42-57 contain a collection of before and
after photos of glaciers claiming to show how
they have been melting away because of
anthropogenic global warming.
29
From An Inconvenient Truth, p 56.
30
From An Inconvenient Truth, p 57.
31
The Real Truth
Glaciers around the world have been melting since
the end of The Little Ice Age in the mid-1800sa
period long before anthropogenic global warming
could have been having an impact.
The majority of glaciers from around the
worldoutside of the Antarctic of which we know
almost nothingare now receding. Hans
Ahlmann, The Present Climate Fluctuation, 1948,
The Geographical Journal
32
The Real Truth
The Abrekke Glacier, in Jotunheim, Norway
1946 (before anthropogenic global warming)
1869
33
The Real Truth
Argentiere Glacier, French Alps
1966 (before anthropogenic global warming)
1850
34
An Inconvenient Truth
The red lines show how quickly the Columbia
Glacier in Alaska has receded since 1980. p.
50-51
35
The Real Truth
According to glaciologist Dr. Tad Pfeffer, who
has spent years studying the Columbia glacier,
its recession has little to do with anthropogenic
global warming. The Columbia glaciers
retreat appears to be due to a combination of
complex physical processes. The start of the
retreat in 1980 is not the direct result of
global warming, but was triggered by longer-term
warming. The Columbia Glacier, like all Alaska
glaciers, is melting at an increased rate, but
the enormous volume of loss accompanying the
retreat is much greater than melt alone. The
retreat of the Columbia Glacier and Alaskas
other tidewater glaciers are believed to be
influenced by a slow warming trend that began in
the Northern Hemisphere about 500 years ago.
36
An Inconvenient Truth
This is Mount Kilimanjaro in 1970 with its
fabled snows and glaciers. p. 42
Here it is just 30 years laterwith far less ice
and snow. p. 43
within 10 years there will be no more Snows of
Kilimanjaro. p. 45
37
The Real Truth
The snow and ice fields on Mt. Kilimanjaro have
been in decline since the late 1800s thought to
be caused largely by a regional decline in
precipitation.
According to Kaser et al.s 2003 study A
drastic drop in atmospheric moisture at the end
of the 19th century and the ensuing drier
climatic conditions are likely forcing glacier
retreat on Kilimanjaro.
When Hemingway writes Snows of Kilimanjarohalf
of the snows are already gone
X
38
An Inconvenient Truth
Our own Glacier National Park will soon need to
be renamed the park formerly known as Glacier.
p. 46
39
The retreat of glaciers in Glacier National Park
initiated earlier in the 20th century, during the
earlier natural warming shift from 1910 to 1940,
before large industrial CO2 emissions.
1930s large summer temperature warming of over 2C
Sperry Glacier
large decline in size of glaciers initiated
earlier in the 20th century
Grinnell Glacier
1910s
Hall and Fagre (2003) BioScience, vol. 53, 131-140
40
The Real Truth
Glaciers in Glacier National Park, as well as
other locations from around the world, have been
receding since the end of the Little Ice Age in
the mid-1800s.
Writing in 1952, more than a half-century ago,
Dightman and Beatty report on the results of a
new program of aerial mapping of Glacier National
Park initiated in 1950 that compared new
photographs with earlier glacial mapping efforts.
Here are a few highlights During the 60-year
period following the first written or
photographic records of the these glaciers, all
have been rapidly depleted in both area and
volume All glaciers lost at least 50 percent
of their surface area in the 50-year period
following the turn of the present 20th century
some lost as much as 80 percent, and several
disappeared entirely. Dightman, R.A., and M.
E. Beatty. 1952. Recent Montana Glacier and
Climate Trends, Monthly Weather Review
41
The Real Truth
Available records dating back to 1897 and direct
observation by the authors over a 4-year period
i.e., 1935-1938 indicate that Grinnell Glacier
has been reduced to about half the size it was in
1900, and that the recession during recent years
has been most rapid.
Gibson and Dyson (1939) Bulletin of the
Geological Society of America, vol. 50, 681-696
42
The Real Truth
It is well-documented that the upper body of
Grinnell Glacier was separated from the lower
body during the warm 1930s when mans CO2 forcing
was too small to be responsible for it!
August 1911
August 1935
43
August 29-30, 1937
Pictorial record of the recession of Grinnell
Glacier, in Glacier National Park.
July 5, 1958
August 2005
September 8, 1965
Images courtesy of NSIDC/WDC, Boulder and Dr.
Quang-Tuan Luong (email communication 6/14/2006)
44
An Inconvenient Truth
And in recent years the rate of increase of
global temperatures has been accelerating. p. 72
45
The Real Truth
There has been no acceleration at all in the rate
of global temperature rise during the past 30
years. The overall rise has been occurring at a
remarkable stable rate of 0.17ºC/decade.
46
An Inconvenient Truth
We have already begun to see the kind of
heatwaves that scientists say will become much
more common if global warming is not addressed.
In the summer of 2003 Europe was hit by a massive
heatwave that killed 35,000 people. p. 75
47
The Real Truth
Heat-wave mortality has been declining in major
U. S. cities during the past 40 years, despite
rising summer temperatures.
Average Annual Heat-Related Mortality in Large
U.S. Cities
This relative desensitization of the U.S.
metropolitan populace to weather-related heat
stress can be attributed to a variety of factors,
including improved medical care, infiltration of
air conditioning, better public awareness
programs relating the potential dangers of heat
stress, and both human biophysical and
infrastructural adaptations. Thus, heat-related
mortality in the United States seems to be
largely preventable at present. Davis et al.,
2003. Changing Heat-related Mortality in the
United States, Environmental Health Perspectives.
Going down
48
The Real Truth
The more common heatwaves become, the better we
become accustomed to them.
Heatwaves are dangerous when they are rare
because people don't know the appropriate actions
to take to avoid the dangerous impacts. This is
demonstrated by the large number of deaths in
Europe in 2003. But, the average daily
temperatures in Phoenix are higher than those
experienced in Europe during the summer of 2003
and Phoenix is one of our fastest growing cities.
Obviously, adaptations can and are made when heat
is commonplace.What does this mean for the
future? Well, if heat waves do become more
common, then we will become better prepared for
them and incorporate them into our daily lives
and routines--just as the people of Phoenix and
Dallas and Houston and New Orleans, etc. do every
summer day.
Average Annual Heat-related Mortality Across the
United States, by decade.
Heat-related mortality is rare in our hottest
cities
49
An Inconvenient Truth
The actual ocean temperatures are completely
consistent with what has been predicted as a
result of man-made global warming. p. 79
50
The Real Truth
Ocean temperatures have unexpectedly declined the
past several years.
The updated time series of ocean heat content
presented hereand the newly estimated confidence
limitssupport the significance of previously
reported large interannual variability in
globally integrated upper-ocean heat content....
However, the physical causes for this type of
variability are not yet well understood.
Furthermore, this variability is not adequately
simulated in the current generation of coupled
climate models used to study the impact of
anthropogenic influences on climate. Lyman et
al., 2006, Cooling of the Upper Ocean,
Geophysical Research Letters.
51
An Inconvenient Truth
Also in 2004, the all-time record for tornadoes
in the United States was broken. p. 86
52
The Real Truth
Deaths from tornadoes in the United States have
been declining.
The increase in the observed number of all
tornadoes is a result of the expanded use of
doppler radar, an increase in the number of
observers (or storm chasers), and an increase
in the population density. Small tornadoes that
were once missed are now being detected by radar
and the larger observing network. The number of
strong tornadoesthose less likely to have ever
been missedhave not changed at all.
Annual Number of Tornado Deaths in the United
States
Tornado Deaths Going Down
53
An Inconvenient Truth
The emerging consensus linking global warming to
the increasingly destructive power of hurricanes
has been based in part on research showing a
significant increase in the number of category 4
and 5 hurricanes. p. 89
54
The Real Truth
Based on data over the last twenty years, no
significant increasing trend is evident in the
global number of Category 45 hurricanes.
The recent destructive Atlantic hurricane
seasons and several recent publications have
sparked debate over whether warming tropical sea
surface temperatures (SSTs) are causing more
intense, longer-lived tropical cyclones. This
paper investigates worldwide tropical cyclone
frequency and intensity to determine trends in
activity over the past twenty years during which
there has been an approximate 0.20.4C warming of
SSTs. The data indicate a large increasing trend
in tropical cyclone intensity and longevity for
the North Atlantic basin and a considerable
decreasing trend for the Northeast Pacific. All
other basins showed small trends, and there has
been no significant change in global net tropical
cyclone activity. Klotzbach, 2006, Trends in
global tropical cyclone activity over the past 20
years (1986-2005), Geophysical Research Letters.
55
An Inconvenient Truth
Major storms spinning in both the Atlantic and
the Pacific since the 1970s have increased in
duration and intensity by about 50 percent. MIT
Study, 2005. p. 92-93
56
The Real Truth
I Dr. Christopher Landsea question the MIT
Study on the following grounds it does not
properly represent the observations described
the use of his Atlantic bias-removal scheme may
not be warranted and further investigation of a
substantially longer time series for tropical
cyclones affecting the continental United States
does not show a tendency for increasing
destructiveness. These factors indicate that
instead of unprecedented tropical cyclone
activity having occurred in recent years,
hurricane intensity was equal or even greater
during the last active period in the
mid-twentieth century. Landsea, 2005,
Hurricanes and global warming, Nature.
57
The Atlantic storms are reduced in number in
particular the stronger ones, while the storms in
the eastern Pacific are virtually unchanged
though there is some indication of fewer extreme
storms. In the western Pacific there is little
change. It is interesting to note that the change
in SSTs by between 2-3C has not had any
influence on the numbers and intensities of the
more powerful tropical storms original
emphasis. Bengtsson et al. (2006) Journal of
Climate, accepted
58
Accumulated Cyclone Energy Index Across the
Worlds Tropical Oceans
Is the selective focus on the recent events in
North Atlantic basin in Figure 1 of Emanuel
(2005) scientifically defensible or justifiable?
Chart courtesy of Dr. David Levinson, NOAA (March
28, 2006)
59
The global intensity and longevity of tropical
cyclones, averaged over all ocean basins (global
ACE), is definitely not increasing rapidly as the
tropical SST warms dramatically in the past 16
years
is not increasing rapidly in the past 16 years!
Tropical SST warms significantly from 1990-2005
Source Gray (2006) AMS April 06 paper Global
Warming and Hurricanes and Klozbach (2006) GRL,
in press
60
The North Indian Ocean shows no correlation
between Sea Surface Temperatures and ACE. The
South Indian Oceans correlation is actually
negative.
Data courtesy of Phil Klotzbach, Colorado State
University
61
An Inconvenient Truth
There is now a strong, new emerging consensus
that global warming is indeed linked to a
significant increase in both the duration and
intensity of hurricanes. p. 81 Then, it passed
over the unusually warm waters of the Gulf of
Mexico. By the time Katrina hit New Orleans, it
was a massive and powerfully destructive storm.
The consequences were horrendous. There are no
words to describe them. p.94-95
62
The Real Truth
Recently, a collection of some of the worlds
leading hurricane researchers issued the
following statement (http//wind.mit.edu/emanuel/
Hurricane_threat.htm)
As the 2006 Atlantic hurricane season gets
underway, the possible influence of climate
change on hurricane activity is receiving renewed
attention. While the debate on this issue is of
considerable scientific and societal interest and
concern, it should in no event detract from the
main hurricane problem facing the United States
the ever-growing concentration of population and
wealth in vulnerable coastal regions. These
demographic trends are setting us up for rapidly
increasing human and economic losses from
hurricane disasters, especially in this era of
heightened activity. Scores of scientists and
engineers had warned of the threat to New Orleans
long before climate change was seriously
considered, and a Katrina-like storm or worse was
(and is) inevitable even in a stable climate.
There is general agreement that we cant
attribute any particular hurricane to global
warming.
Kerry Emanuel, Richard Anthes, Judith Curry,
James Elsner, Greg Holland, Phil Klotzbach, Tom
Knutson, Chris Landsea, Max Mayfield, Peter
Webster
63
An Inconvenient Truth
In 2005, something new happened We ran out of
names. For the first time in history, the World
Meteorological Organization had to start using
the letters of the Greek alphabet to name the
hurricanes and tropical storms that continued
into Decemberwell past the end of the 2005
hurricane season. Here are all 27 of them
photographs of each storm follow. p103-105.
64
The Real Truth
The 28 Atlantic tropical storms and hurricanes in
2005 broke the previous record of 21 set in
1933but notice the lack of storms in the eastern
and central Atlantic in 1933. No ships were
there to take observations. In 2005, satellites
covered the entire basin. Were some storms
missed in 1933?
1933 tracks
2005 tracks
65
An Inconvenient Truth
Pages 80-105 of An Inconvenient Truth contain
photo after photo of hurricanes and hurricane
damage from years 2004 and 2005, implying that
they show scenes of destruction that result from
global-warming fueled tropical cyclones.
66
New Orleans, LA, September 2005 (from An
Inconvenient Truth, p 97-98)
67
New Orleans, LA (from An Inconvenient Truth, p
97-98)
68
Cameron, LA, Aftermath of Hurricane Rita,
September 2005 (from An Inconvenient Truth, p
97-98)
69
The Real Truth
But the truth is, hurricanes have been taking
lives and causing damage in the United States
long before anthropogenic global warming could
ever have played a role.
70
Galveston, TX, September 1900 6,000 to 8,000
deaths (from NOAA Photo Library)
71
Aftermath of the New England Hurricane of
1938 (NOAA Photo Library)
72
New England Coast, 1938
73
Mississippi, aftermath Hurricane Camille, August
1969 (NOAA Photo Archives)
74
An Inconvenient Truth
After the pages of hurricane photos, Gore gives
us photo after photo of the aftermaths of floods
and drought from recent years. Again, the
implication is clearthese scenes of destruction
are the result of global warming-induced climate
changes (pages 106-121).
75
It was almost like a nature hike through the
book of Revelation. (from An Inconvenient Truth,
p108-109)
76
Farmer in drought-ravaged field, Wharton County,
TX, 1998 (from An Inconvenient Truth, p.120)
77
The Real Truth
Devastation from floods and droughts have been
occurring since the beginning of recorded
history. Anthropogenic global warming need not be
invoked as their cause.
78
The aftermath of the Johnstown Flood Johnston,
PA, 1889, in which 2,200 people died (from NOAA
Photo Archives)
79
The southeast floods of 1916 The Spring Street
approach to Smith's Bridge in Asheville, NC
(From The Floods of July, 1916, published by
Southern Railway Company, 1917)
80
Drowned horses litter the streets of Dayton, OH
after the flood receded. As seen in Our
National Calamity of Fire, Flood, and Tornado by
Logan Marshall, 1913. L. T. Myers publisher.
These floods caused 527 deaths.
81
Dust Over Dakota. A forlorn farmer leans into a
dust storm. In To Hold This Soil, Russell Lord,
1938. Miscellaneous Publication No. 321, U.S.
Department of Agriculture.
82
An Inconvenient Truth
Since the 1970s, the extent and thickness of the
Arctic ice cap has diminished precipitously.
There are now studies showing that if we continue
with business as usual, the Arctic ice cap will
completely disappear each year during the
summertime. p. 143
83
The Real Truth
The monthly time series of Arctic sea ice,
available from the National Snow and Ice Data
Center, shows that the Arctic is not in imminent
danger of losing all of its ice, in any season.
Even in the middle of summer, there is still
nearly 5 million square kilometers of ice
present. In the winter, the area of ice typically
exceeds 13 million square kilometers. Melting
Arctic sea ice does not add to sea level rise.
84
An Inconvenient Truth
Gore relates concern over greenhouse warming
and the rapid melting of Greenland ice causing
the stopping or disruption of the North Atlantic
Ocean Conveyor and the Gulf Stream, tossing
Europe back into a 1,000-year ice age. (pp.
148-151.)
85
The Real Truth
A team of researchers found that mass ice balance
in Greenland is growing, not shrinking.
spatially- averaged rate 5.4 0.2 cm/year
Johannessen et al. (2005) Science, vol. 310,
1013-1016
86
An Inconvenient Truth
The currents of the ocean are all linked like a
big Mobius strip in a loop called the The Global
Ocean Conveyer Belt. This massive sinking
phenomenon is described by scientists as a giant
pump. More specifically, they call it a
thermohaline pump because it is driven both by
temperature and by salinity. (pp. 148-151.)
Or thermohaline circulation
87
The Real Truth
Real experts disagree
The idea that the Gulf Stream is driven both by
the rotation of the Earth and by a deep-water
current called the Thermohaline Circulation is
false. The Gulf Stream is a wind-driven
phenomenon. Heating and cooling affect its
temperature and other properties, but not its
basic existence or structure. As long as the sun
heats the Earth and the Earth spins, so that we
have winds, there will be a Gulf Stream If the
sinking were stopped by adding fresh water (a
deus ex machina often invoked to change the
climate), the Gulf Stream would hardly care
except in so far as the wind system changed too.
Many writers, including scientists, toss around
the words Thermohaline Circulation as though
they constituted an explanation... Many real
climate change effects exist and require urgent
attention focusing on near-impossible Gulf
Stream failure is an unproductive distraction.
Shut-off would imply repeal of the law of
conservation of angular momentum Widely
disseminated and grossly oversimplified pictures
showing the ocean as a conveyor belt have
misled people into thinking ocean circulation is
driven by a sinking motion at high latitudes.
Carl Wunsch, Professor of Physical Oceanography
(MIT)
88
The Real Truth
Real experts disagree (cont)
The latest analyses of ocean observations and
model simulations suggest that changes in the
thermohaline circulation (THC) during the last
century are likely the result of natural
multidecadal climate variability. Indications of
a sustained THC weakening are not seen during the
last few decades. Instead, a strengthening since
the 1980s is observed.
M. Latif, J. Willebrand, A. Biastoch, J.
Dengg, N. Keenlyside, U. Schweckendiek, G.
Madec
Journal of Climate, Volume 19, Issue 18
(September 2006)
89
An Inconvenient Truth
The age-old rhythm of the Earths
seasonssummer, fall, winter, and springis also
changing as some parts of the world heat up more
rapidly than others. A study from the
Netherlandsshows that 25 years ago, the peak
arrival date for migratory birds was April 25.
Their chicks hatched almost six weeks later,
peaking on June 3, just in time for the height of
the caterpillar season. Now two decades of
warming later, the birds still arrive in late
April, but the caterpillars are peaking two weeks
earlier, leaving mother birds without their
traditional source of food for the chicks as a
result, the chicks are in trouble Global
warming is disrupting millions of delicately
balanced ecological relationships among species
in just this way. p. 152-153
90
The Real Truth
Plants and animal species have been responding
and adapting to the Earths climate variations
for eons. The current period is no exception to
that. In commenting on the implications of the
Netherlands bird study, one scientist said, If
the birds in the Netherlands would arrive too
late to profit from the short period of food
availability, they may continue migration to the
north, say to Scandinavia, until they meet a site
where their timing of arrival and breeding is
still pretty much tuned to the timing of the
caterpillar peak. A fairly simple
adaptation. Also, notice that Gore draws us
emotionally into the plight of the mother birds,
but never makes mention of the fact that the
caterpillars (and resulting butterflies) are no
doubt flourishing, having outwitted the birds!
91
The Real Truth (cont.)
As an aside, the subject of Gores tale of the
plight of the migratory bird that is now arriving
in the Netherlands too late for peak caterpillar
season is a species of a small bird named the
pied flycatcher. The photo accompanying the text,
on page 153 of An Inconvenient Truth is captioned
Black tern feeding younga completely different
species of bird! The black tern is a marsh bird
that feeds on small fish and flying insects (not
caterpillars). And, indeed, a closer look at the
photo shows the Real Truththe mother bird is
feeding its chicks a tiny fish!
92
The Real Truth
In 1948, Hans Ahlmann, writing in The
Geographical Journal, described the climate
fluctuation that had been occurring since the
early part of the 20th century, as temperatures
rose worldwide (before any large anthropogenic
influences). He documented this climate
improvement with reviews of thermometer
measurements, retreating glaciers, rising sea
levels, and shifting species.
93
The Real Truth (cont.)
Concerning species shifts Ahlmann (1948)
wrote Another result of the changed conditions
is that various kinds of fish have migrated
northwards. The most remarkable movements have
been those of the common cod. In the later years
of last century and the beginning of the present,
the common cod was found at only a few places in
the waters of south-west Greenland and only in
small numbers. But since 1917 they have gradually
migrated farther north, and in steadily
increasing numbersthe cod has migrated 9º of
latitude in twenty-seven years. ...The greatest
economic benefit derived from the improved
climate will, however, be increased vegetation
growth. An extension of barley cultivation has
occurred in Icelandit is also noteworthy that in
Iceland the northern species of both birds and
insects are gradually disappearing and southern
species are taking their place. In Norwaythe
limit of cultivation in the mountains has
ascended during recent decades. Prospects for
agriculture have improved in northern Sweden and
Finland, due not only to better seed and improved
methods of cultivation but also to a lengthening
of the vegetation period. In the forests of
Scandinavia the economic benefits are of special
significance. The trees are spreading rapidly
above their former limits.
94
An Inconvenient Truth
Many species around the world are now threatened
by climate change, and some are becoming extinct
in part because of the climate crisis and in
part because of human encroachment into the
places where they once thrived. p. 163
95
The Real Truth
Predictions of extinctions are among the most
bogus forecasts arising out of the models. The
existing data on the observed rates of species
extinction are almost ludicrously inconsistent
with Gores claims of rapid disappearance. The
record of continental bird and mammal extinctions
reveals that in the last 500 years there have
been only nine recorded extinctions (six birds
and three mammals) and no continental forest
bird or mammal is recorded as having gone extinct
from any cause since 1991. The 500-year record
includes the Modern Warm Period of the 20th
century and the so-called "Little Ice Age" of the
1600 and 1700's, when global temperatures were
much lower than today. Claims that small climate
changes can cause widespread extinctions are thus
discredited because the historical record shows
no sign of extinctions from small climate changes.
96
Polar bears are not facing a crisis, according to
biologist Dr. MitchellTaylor from the Arctic
government of Nunavut. "Of the 13 populations
ofpolar bears in Canada, 11 are stable or
increasing in number. They arenot going extinct,
or even appear to be affected at present,"
http//www.thestar.com/NASApp/cs/ContentServer?pag
enamethestar/Layout/Article_Type1cArticlecid1
146433819696call_pageid970599119419
97
An Inconvenient Truth
In fact, we are facing what biologists are
beginning to describe as a mass extinction
crisis, with a rate of extinction now 1,000 times
higher than the normal background rate. p.163
98
The Real Truth
The issue of biodiversity resembles the classic
battle between model and reality. The dramatic
loss claim of biodiversity, expressed in the
40,000 species a year, is a dramatic figure,
created by models. But it is a figure which
conflicts with both observation and careful
modeling.
Add quote from p. 254 in Lomborg
99
The Real Truth Hardly a crisis
The complete record of every known bird and
mammal extinction. In general, the timing
reflects the various phases of the expansion of a
variety of European species, including humans.
Starting from the Caribbean extinctions in the
1500's, extinctions continue through the age of
exploration in the 1700's and the colonial period
of the 1800s. This wave of "alien species"
extinctions peaked around 1900 at 1.6 extinctions
per year. Extinction rates have dropped since
then, with the most recent value being 0.2
extinctions per year.
The 500-year record includes the Modern Warm
Period of the 20th century and the so-called
"Little Ice Age" of the 1600 and 1700's, when
global temperatures were much lower than today.
Claims that small climate changes can cause
widespread extinctions are thus discredited
because this historical record shows no sign of
mass extinctions from climate changes.
Stacked graph of the historical extinction rates
for birds (grey) and mammals (black). 17 year
Gaussian average of the data from Red List
(birds) and CREO (mammals). Note the peak rate of
1.6 bird and mammal extinctions per year, and the
most recent rate of 0.2 extinctions per year.
100
An Inconvenient Truth
Coral reefs, which are as important to ocean
species as rainforests are to land species, are
being killed in large numbers by global warming.
p. 164
Coralsalong with many other ocean life
formsare threatened by the unprecedented growth
of carbon dioxide emissions worldwide, not only
because these gases build up in the atmosphere or
our planet and increase ocean temperatures, but
also because up to one-third of all those
emissions end up sinking into the ocean and
increasing the acidity of the water. p. 168
101
The Real Truth
Exaggeration. Two marine biologists have recently
concluded that from 10,000 to 6,000 years ago,
extratropical North Atlantic sea surface
temperatures (SSTs) were 2- 3C warmer than at
present and coral reefs flourished. They
reported that the fossil record clearly
demonstrates the ability of corals to expand
their ranges poleward in response to global
warming and to "reconstitute reef communities in
the face of rapid environmental change." In fact,
they report that coral range expansions are
occurring today, noting that "there is mounting
evidence that coral species are responding to
recent patterns of increased SSTs by expanding
their latitudinal ranges."
Precht, W.F. and Aronson, R.B. 2004. Climate
flickers and range shifts of reef corals.
Frontiers in Ecology and the Environment 2
307-314.
102
The Real Truth
In a paper that appeared in Nature, Andrew Baker
(2001) proposes that bleaching may be an
excellent strategy employed by corals to
sacrifice short-term benefits for longer-term
gains. This line of thinking accounts for corals'
ability to survive over millions of years and
through much harsher climate changes than those
experienced over the last few decades. Two more
recent investigations into the health of the
Great Barrier Reef (GRB) have been presented in
Australia by the Queensland Chief Scientist and
the Productivity Commission. Despite an
exhaustive listing in the literature, neither of
these reports was able to find a single
convincing example of substantive damage to the
GBR related to human activity. The Productivity
Commission report (2003) concludes there is "no
conclusive evidence" of water quality decline
within the GBR lagoon or of "any resulting damage
to ecosystems..." But even more important, there
is abundant evidence that the GBR remains in
excellent health within the bounds of the
variations which occur within its natural
environment. In this context, coral bleaching
outbreaks are entirely natural. Natural bleaching
outbreaks probably have been occurring on the GBR
for thousands of years and will continue.
103
The Real Truth
Coral species have been around on earth,
continually evolving, for about the last 500
million years or so. During that time the
atmospheric CO2 concentrations (and global
temperatures) have fluctuated widely. This figure
shows our best understanding of CO2 levels back
in time for about 500 million years (taken from
the 2001 Third Assessment Report of the
IPCC). It is clear that atmospheric
concentration of CO2 were higher than the present
level (380 ppm) for most of the past 500 million
years. During some periods, the levels were
thought to be more than 10 times current levels.
And corals survived. All signs are that corals
are a lot hardier than Gore gives them credit for.
Present CO2 Level
Atmospheric CO2 concentration during the past 500
million years (source IPCC, 2001).
Age (millions of years before Present)
104
An Inconvenient Truth
And when these disease vectorswhether algae,
mosquitoes, ticks, or other germ-carrying life
formsstart to show up in new areas and cover a
wider range, they are more likely to interact
with people, and the diseases they carry become
more serious threats. p. 172
105
The Real Truth
Important take-home points
- Malaria is not a tropical disease, as far north
as Arctic Circle - In the past, dengue and yellow fever as far north
as Boston - Proponents of climate-based change ignore basic
principles - Climate is only one of many factors in
transmission - Current models cannot predict future
transmission - No evidence of changes in transmission due to
climate - Public conceptions are manipulated by special
interest groups - The public and their decision makers are
vulnerable to abuse
Paul Reiter, Insects and Infectious
Diseases Pasteur Institute, Paris,
France (Formerly with the Center for Disease
Control, Atlanta)
106
The Real Truth
The spread and incidence of disease is best
controlled by direct measures, not by climate
changes. For instance, the tropical disease
malaria was endemic across much of the United
States east of the Rocky Mountains in the late
1800sa relatively cool periodwhereas now,
despite higher temperatures, malaria has been
eradicated from the U.S. Public health measures
trump climate every time.
Areas of the United States where malaria was
thought to be endemic in 1882.
107
The Real Truth about Malaria
Studies have shown no relation between climate
(periodic ups and downs) and malaria incidence,
but lots of evidence for drug resistance,
cessation of use of insecticides like DDT,
movements of people from malaria-burdened
lowlands, etc. Until the second half of the
20th century, malaria was endemic in the U.S. and
widespread in many temperate regions, with major
epidemics as far north as the Arctic Circle.
108
The Real Truth about Malaria
Malaria in the United States 1882 - 1935
In the current warmer climate, Malaria has been
completely eradicated
1932
1882
1912
1934-5
109
An Inconvenient Truth
Mosquitoes move to higher elevations,
p.173 Before 1970, cold temperatures cause
freezing at high elevations and limited
mosquitoes and mosquito-borne diseases to low
altitudes Today, increased warmth has caused
some mosquitoes and mosquito-borne diseases to
migrate to higher altitudes.
110
The Real Truth
"Gore is completely wrong herethe new altitudes
of malaria are lower than those recorded 100
years ago" and "none of the 30 so-called new
diseases Gore references are attributable to
global warming".
Professor Paul Reiter head of the Pasteur
Institute's unit of insects and infectious
diseases
111
The Real Truth
The claim that only the recent warming has
caused some mosquitoes and mosquito-borne
diseases to migrate to higher altitudes is a
complete fiction. (Professor Paul Reiter )
Recent malaria expansion at the equator, compared
to transmission recorded altitudes 1880-1945
(before the current warming)
? 1880 - 1945 ? Recent
?
112
The Real Truth
Certainly, climate lays down the broad lines of
malaria distribution. Nevertheless, although
this is a very simple and plausible explanation
even the early malariologists (sic!) felt that
there was something unsatisfactory about it
malaria has not so much receded as it has
contracted, oftentimes toward the north... Thus
in Germany it is the northern coast which is
still malarious, the south is free There is,
therefore, no climatic reason why (malaria)
should have abandoned south Germany or the French
Riviera
L. W. Hackett (1937) Malaria in Europe
113
The Real Truth about ticks
Leading disease scientists contend that climate
change plays only a minor role in the spread of
emerging infectious diseases. In Global Warming
and Malaria A Call for Accuracy (The Lancet,
June 2004), nine leading malariologists
criticized models linking global warming to
increased malaria spread as misleading and
displaying a lack of knowledge of the
subject.
114
The Real Truth about ticks
One of Gores advisors claims that the current
warming is responsible for the increased
incidents of tick-borne Lyme disease.
Leading specialists have found the opposite to be
true Mean temperatures show weak and
inconsistent correlations with incidence.
Incidents are instead related to New England
farmlands returning to forests near homes,
creating edge habitat and an explosion in deer
populations which carry the blackleg tick. Lyme
disease is not a problem in the warmer Southern
states.
In 2000, Reported Lyme Disease Cases Per 100,000
Population (Incidence Rate)
http//www.ff.org/centers/csspp/misc/press1/co2/20
051118.pdf
115
An Inconvenient Truth
One example is the West Nile virus, which
entered the United States on the eastern shore
of Maryland in 1999 and within two years crossed
the Mississippi. Two years after that, West Nile
spread all the way across the continent. p. 175
116
The Real Truth
West Nile virus spread rapidly upon its
introduction in the United States because the
principal carriers, birds and mosquitoes, are
already plentiful in the United Statesclimate
change had nothing to do with it. As Gore
mentions, West Nile has now spread across the
North American continent. What he didnt point
out was that the North American continent
contains nearly all the climate types of the
worldfrom hot deserts to frigid tundraa range
that dwarfs any small alteration to temperatures
or precipitation amounts that may be related to
anthropogenic activities. Obviously, West Nile
can exist in virtually any climatethus any small
climate change plays no role whatsoever in its
distribution or its rapid spread across North
America.
117
An Inconvenient Truth
At right is the Antarctic Peninsula. Each orange
splotch represents an ice shelf the size of Rhode
Island or larger that has broken up since 1978
p. 180
118
The Real Truth
Although Gore includes a small map in the upper
right-hand corner of his illustration, he makes
no mention of the fact that the Antarctic
Peninsula makes up only about 2 of the total
area of Antarctica. Over the remainder of the
continent, and in the surrounding Southern Ocean,
ice has been accumulating during the past several
decades (see plus signs).
Area of growing sea ice surrounding Antarctica
Ice mass trends on land
119
The Arctic-wide (northward of 62ºN) surface air
temperatures were higher than today during the
1920-1940 period, before major industrial
releases of CO2.
Polyakov et al. (2003) Journal of Climate, vol.
16, 2067-2077 (figures courtesy of Igor Polyakov,
International Arctic Research Center)
p. 2068
of Polyakov et al. (2003) specifically noted that
their composite Arctic temperature used data from
stations northward of 62ºN only and Polyakovs
Arctic-wide temperature contains data from
coastal land stations, Russian drifting stations
around North Pole and drifting buoys from
International Arctic Buoy Programme
120
Observed Winter Surface Cooling over Arctic-whole
and Central Arctic Ocean for 1982-1999 by polar
AVHRR Contradicts warming predictions from GCMs
Note the observed winter surface cooling over the
Eastern and Central Arctic Ocean from 1982-1999
by AVHRR instruments are in sharp CONTRADICTION
to the predicted CO2-induced warming trends
Alaska
Greenland
Wang and Key (2003) Science, vol. 299, 1725-1728
121
An Inconvenient Truth
Many residents of low-lying Pacific Island
nations have already had to evacuate their homes
because of rising seas. p. 186
Gore highlights Tuvalu
HIGH TIDE IN FUNAFUTI, TUVALU POLYNESIA
122
The Real Truth
The Australian National Tidal Facility at Tuvalu
in 2002 reported "The historical record from
1978 indicated a sea level rise of 0.07 mm per
year." Or the width of a hair. Says Auckland
University climate scientist Chris de Frietas
"I can assure Mr Gore that no one from the
South Pacific islands has fled to New Zealand
because of rising seas."
123
The Real Truth
Is sea level rise accelerating?
An accelerated rise in sea level rise is far from
scientifically established. Several recent
studies concluded that the rate of global sea
level rise has been rather stable over the past
century or more at a mean value of approximately
1.8 0.3 mm yr-1. Recently, White et al.
(2005) conducted an analysis of the available
data in an attempt to find the elusive predicted
increase in the sea level's rate of rise
(acceleration). They compared estimates of
coastal and global averaged sea level between
1950 and 2000 and concluded their results confirm
earlier findings of "no significant increase in
the rate of sea level rise during this 51-year
period" (the last half of the 20th century which
includes two decades of a supposedly
"unprecedented" rate of temperature increase.)
124
The Real Truth
Claims that late 20th-century global warming has
been unprecedented over the past two millennia
cannot be detected in global sea level data.
Two Hundred Years of Global Sea Level Data
Jevrejeva et al. say their findings show that
"global sea level rise is irregular and varies
greatly over time," noting that "it is apparent
that rates in the 1920-1945 period before
substantial CO2 emissions are likely to be as
large as today's."
It is not possible to detect a significant
increase in the rate of sea level rise over the
period 1950-2000.
125
The Real Truth
Real world data (1992-2005, show no acceleration
in sea level rise around the Pacific Island
nations.
Tuvalu
126
The Real Truth
Real world data (1992-2005, show no acceleration
in sea level rise around the Pacific Island
nations.
Tuvalu
127
The Real Truth
Bill Mitchell, Acting Director of the National
Tidal Facility, Adelaide, South Australia
recently observed Although there has been a
lot of discussion and debate linking the
vulnerability of atoll islands to the impacts of
global change, this has suffered for several
reasons. There is scientific uncertainty about
sea-level rise predictions. Problems exist with
interpretations of sea-level trends from tidal
data for the last century. There is a poor
understanding of change and dynamics in atoll
environments. Erosion is often quoted as an
impact of sea-level rise but there are very few
studies giving accurate assessments of how much
erosion will occur and how the low-lying reef
island will respond. Not enough is known about
the natural variability of atoll islands in order
to identify global change-induced effects. The
result has been that many assessments are, to a
large extent, based on speculation. This has not
helped the small-island states of the atoll
countries, particularly when discussing the
impacts of global change in international fora.
128
An Inconvenient Truth
The Thames River, which flows through London, is
a tidal river. In recent decades higher sea
levels began to cause more damages during storm
surges, so a quarter of a century ago, the city
built these barriers that can be closed for
protectionThe graph below shows how frequently
London has had to use these barriers in recent
years. p.189
129
The Real Truth
According to the U.K. Department of Environment,
Food, and Rural Affairs, in their report
Indicators of Climate Change in the
U.K. Because the Thames River Barrier is now
subject to different operating rules, it may be
less useful as an indicator of flood defence.
The barrier is now closed to retain water in the
Thames River as well as to lessen the risk of
floodingThus, the number of closures has
increased greatly in recent years.
130
An Inconvenient Truth
If Greenland melted or broke up and slipped into
the seaor if half of Greenland and half of
Antarctica melted or broke up and slipped into
the sea, sea levels worldwide would increase by
between 18 and 20 feet The maps of the world
would have to be redrawn. p.196-197 Pages
198-209 contain computer simulated maps of
familiar and populous shorelines before and after
a 18-20 foot rise in sea level.
131
The Real Truth
According to the 2001 Third Assessment Report of
the United Nations Intergovernmental Panel on
Climate Change the projected range of possible
sea level rise by the year 2100 is between 3.5
and 34.6 inches with a central value of 18.9
inches. The central value sea level rise estimate
is more than 10 times less than Gores lurid
imagery depicts.
Projection of future sea level rise (from the
IPCC, TAR, 2001, p. 65)
132
An Inconvenient Truth
Gores Greenland Melting, pp. 194-195
In 1192 scientists measured this amount of
melting in Greenland as indicated by the red
areas of the map. Ten years later, in 2002, the
melting was much worse. And in 2005 it
accelerated dramatically yet again.
2005
1992
2002
133
The Real Truth
Greenland Ice-sheet is growing at interior and
high-elevation regions (1992-2003)
Ice accumulating at interior and
high-elevation sites of Greenland
Ice ablating at coastal and lower elevation
sites of Greenland only
spatially- averaged rate 5.4 0.2 cm/year
areas with greater than 1500 meter elevation
(interior)
areas with less than 1500 meter elevation
(coastal)
Ice-sheet elevation change rate cm/year
Johannessen et al. (2005) Science, vol. 310,
1013-1016
134
The 1995-2005 warming in Greenland is probably
natural and unexceptional when compared to the
warming of the 1920-1930
The Real Truth
Chylek et al. (2006) GRL, in press (preprint
dated May 5, 2006)
135
An Inconvenient Truth
Gore cites a study by a social scientist
supposedly demonstrating that the vast majority
of scientists are in agreement about global
warming, and that the debate should therefore be
over.
According to Gore, Dr. Oreskes claimed that a
search of the ISI Web of Knowledge Database for
the years 1993 to 2003 under the
Recommended
CrystalGraphics Presentations


