
Future Of Data Visualization PowerPoint PPT Presentations
All Time
Recommended

Data visualization is far beyond an art. With ever-evolving cognitive frameworks, multidimensional imaging, and intelligence, data visualization is opening gateways to visualize huge amounts of complex data. A modern substitute for visual communication, data visualization facilitates seamless decision-making for businesses.
| PowerPoint PPT presentation | free to download
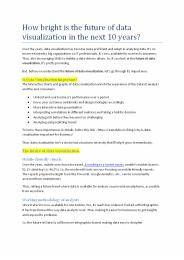
Data visualisation has had a huge impact throughout the years, not just in major companies but also in medium and small businesses. Every day, 2.5 quintillion bytes of data are generated around the world, which will be wasted if not organised properly. As a result, the future of data visualisation is both secure and vital!
| PowerPoint PPT presentation | free to download
Data Visualization Course by Henry Harvin.
| PowerPoint PPT presentation | free to download

The art of using visual thinking to understand complex information. Origin (maps) ... data used by Fox news to show the results for the recent presidential election ...
| PowerPoint PPT presentation | free to view

Crafting remarkable user experiences in the ever-advancing world of app development involves a blend of innovation and technology. One of the driving forces behind this evolution is the seamless integration of dynamic data visualization. At the forefront of this transformative approach stands React.js, a JavaScript library revered for its efficiency and component-based architecture. Beyond being a mere tool, React.js empowers us to reimagine and create visually captivating, interactive, and data-driven dashboards, reshaping the landscape of app development. Join us on this journey as we delve into the transformative potential of React.js in redefining user experiences through data visualization.
| PowerPoint PPT presentation | free to download
Perceptive Analtyics is a data analytic company and a trusted advisor to its clients across domains
| PowerPoint PPT presentation | free to download

3D visualization Services has taken contemporary architecture to another level from the past few decades. It has made significant progress in terms of quality and speed, making the projects streamlined, faster, and easier, allowing the architects & other experts to significantly improve the quality of the process of creating the particular data.
| PowerPoint PPT presentation | free to download

Data Sports Group is the market leading provider of sports data & statistics for media publishers, fantasy & gaming apps worldwide covering an impressive catalogue of over 35+ sports
| PowerPoint PPT presentation | free to download
The world of data science is rapidly expanding. And python being a multi-paradigm is able to handle everything from website designing to running of embedded systems. With a gist of python anyone can do it
| PowerPoint PPT presentation | free to download
Large multidimensional databases have become very common ... Cartography. Multiscale information visualization. Pad : alternate desktops. DataSplash ...
| PowerPoint PPT presentation | free to download

Can you guess how much data is produced every day? 1.145 trillion MB/day. And, it will surpass this number very quickly, considering the growing number of internet users every passing day. A source predicts that by 2025, 463 exabytes of data will be created. Isn't it crazy? It does sound so.
| PowerPoint PPT presentation | free to download
Summary Data management is a pain-staking task for the organizations. A range of disciplines are applied for effective data management that may include governance, data modelling, data engineering, and analytics. To lead a data and big data analytics domain, proficiency in big data and its principles of data management need to be understood thoroughly. Register here to watch the recorded session of the webinar: https://goo.gl/RmWVio Webinar Agenda: * How to manage data efficiently Database Administration and the DBA Database Development and the DAO Governance - Data Quality and Compliance Data Integration Development and the ETL * How to generate business value from data Big Data Data Engineering Business Intelligence Exploratory and Statistical Data Analytics Predictive Analytics Data Visualization
| PowerPoint PPT presentation | free to download

Intelligent Data Analysis (IDA) is one of the major issues in artificial intelligence and information. Intelligent data analysis discloses hidden facts that are not known previously and provides potentially important information or facts from large quantities of data (White, 2008). It also helps in making a decision. To Learn More: https://bit.ly/2vKwyYw Contact Us: UK NO: +44-1143520021 India No: +91-8754446690 Email: info@phdassistance.com Website Visit : https://www.phdassistance.com/
| PowerPoint PPT presentation | free to download

According to research, the human brain processes images within 13 milliseconds. That's how fast our brain is. Think about how easy it is for you to notice details from a graph rather than plain data?
| PowerPoint PPT presentation | free to download

Harnessing New Data Visualization Tools: Say It Visually
| PowerPoint PPT presentation | free to view

WireVis Visualization of Categorical, Time-Varying Data From Financial Transactions Remco Chang, Mohammad Ghoniem, Robert Kosara, Bill Ribarsky, Jing Yang ...
| PowerPoint PPT presentation | free to download

Spatial data analysis tasks and techniques. Applying region growing approaches to segmentation of area data ... Tessellation of space. For example using grids ...
| PowerPoint PPT presentation | free to view

It is used to control the location of the view, set the projection model, set ... It uses an array (pointList) to store 3D location data of each point. ...
| PowerPoint PPT presentation | free to view

What is data visualisation? It is a process that involves gathering unstructured data from a variety of sources, modelling it, and displaying it in an organised and legible manner to improve decision-making.It uses visuals like interactive graphs and charts to communicate data, making it more appealing and easy to understand for all sorts of people.
| PowerPoint PPT presentation | free to download

A graphical depiction of cleansed, analysed, and structured data from various sources is known as data visualisation. Using charts and graphs to model it graphically. Organizing and presenting the information in a visual way to assist decision-makers in reaching a decision. It is necessary not just for a business, but also for an individual, regardless of the job path he selects. In fact, most firms now confront the difficulty of figuring out how to make use of the massive number of data sets available.
| PowerPoint PPT presentation | free to download
Sensors (e.g., images, gauges) Simulations. Census or other surveys. Commerce (e.g., stock market) ... map multivariate data to images, each with strengths and ...
| PowerPoint PPT presentation | free to download

... Data Generation Rate of 85mbps on 32 nodes at NERSC streamed to clusters at PPPL. ... large amount of processors (N) streaming to a small amount of ...
| PowerPoint PPT presentation | free to view
Terry Fox Laboratory, BC Cancer Agency (Prof. Ryan Brinkman & Dr. Josef Spidlen) Today Flow Cytometry Overview Dataset description Existing Visualizations Overview ...
| PowerPoint PPT presentation | free to download
Learning and Practicing Interactive Data Language (IDL) ... Chelsea Vick. Objectives. Introductions. Abstract. Purpose. Conclusion. Future work. Acknowledgements ...
| PowerPoint PPT presentation | free to download

eSDO is an e-science project funded by PPARC to make SDO data and algorithms ... HELAS: European Helio and AstroSeismology Network ...
| PowerPoint PPT presentation | free to view

Collaborative 3D and 4D Visualization in a Distributed Data System
| PowerPoint PPT presentation | free to view

I've been something of a renowned InfoViz crank on this mailing list... Liar! Information Architecture Summit 2004. 6. Skepticism on information visualization ...
| PowerPoint PPT presentation | free to view
Polaris: A System for Query, Analysis, and Visualization of ... Polaris not solely for ... Extended Polaris to fully support and expose hierarchical ...
| PowerPoint PPT presentation | free to download

Jmol and its Potential for Data Mining and Molecular Visualization in Drug Discovery Robert M. Hanson Department of Chemistry, St. Olaf College
| PowerPoint PPT presentation | free to view

The Integrated Data Viewer A webenabled tool for geoscientific analysis and visualization
| PowerPoint PPT presentation | free to download

Special Topics In Database Sadra Abedinzadeh Ashkan Zarnani Farzad Peyravi Outline Motivation and General Description Data Warehousing: Basic Concepts and Techniques ...
| PowerPoint PPT presentation | free to view

Real-time Data Delivery and Remote Visualization through Multi-layer Interfaces ... visualization and animation of radar data only for one station or whole nation ...
| PowerPoint PPT presentation | free to view

Transform your career with our Data Science course in Hyderabad. Master machine learning, Python, big data analysis, and data visualization. Our training and expert mentors prepare you for high-demand roles, making you a sought-after data scientist in Hyderabad's tech scene.
| PowerPoint PPT presentation | free to download

Data Discovery Market size is anticipated to grow significantly over the future owing to the increasing demand of businesses for visualization and explorative data analysis services.
| PowerPoint PPT presentation | free to download
Intellicus Data Science capability empowers businesses to analyze the future by doing machine learning of data, predictive analytics, and what-if Analysis. Data Science helps to dig deep into aa variety of insights. Intellicus Data Science Capabilities are based on: 1) Connectivity 2) Deployment 3) Data Science Tasks 4) Reporting & Visualizations
| PowerPoint PPT presentation | free to download
Transform your career with our Data Science course in Hyderabad. Master machine learning, Python, big data analysis, and data visualization. Our training and expert mentors prepare you for high-demand roles, making you a sought-after data scientist in Hyderabad's tech scene.
| PowerPoint PPT presentation | free to download

Objective: to provide a visualization of model neuron conductance space in order ... 'Translucent' Data Access. Future Work. Conclusion ...
| PowerPoint PPT presentation | free to view
Visualization Andrew Frank CMNS 801
| PowerPoint PPT presentation | free to download

The future scope of Python is exceptionally promising, making it a crucial skill for individuals seeking a competitive edge in the tech industry. Python's versatility, simplicity, and extensive library ecosystem continue to drive its adoption in fields such as web development, data science, artificial intelligence, and more. In Delhi, the demand for Python professionals is particularly high, with numerous job opportunities and career growth prospects. Enrolling in a Python course in Delhi can provide you with the knowledge and skills needed to capitalize on these opportunities and excel in this dynamic and evolving field.
| PowerPoint PPT presentation | free to download

Do you want to turn your data into meaningful information? Would you like to learn from the past to help you plan the future? Data Analytics solutions can help your organization take a strategic turn to beat your competitors. We will clean and analyze your data and provide you with insights to increase the overall efficiency of your business. Do you want to turn your data into meaningful information? Would you like to learn from the past to help you plan the future? Data Analytics solutions can help your organization take a strategic turn to beat your competitors. We will clean and analyze your data and provide you with insights to increase the overall efficiency of your business. https://www.datagrowth.io/
| PowerPoint PPT presentation | free to download
This presentation will educate you about data mining, How data mining works?, Data Mining Techniques, Data Mining Process and Data Mining: Applications. For more topics stay tuned with Learnbay.
| PowerPoint PPT presentation | free to download
https://www.apponix.com/data-science-courses
| PowerPoint PPT presentation | free to download
With outstanding and renowned faculty, MAGES Institute brings you a highly competitive Applied Data Science and Machine Learning Course in which in the first 1-3 weeks you'll learn about data science fundamentals, then in the next 4-9 weeks you'll master data analytics and data engineering. From week 10-12 you'll learn data visualization which will be followed by machine learning in week 13-19. It will end with a capstone/internship in weeks 20-24.
| PowerPoint PPT presentation | free to download

Python's ascendancy in the data science domain is rooted in its simplicity, readability, and a vast array of libraries specifically designed python for data analysis. Libraries such as NumPy, Pandas, and Matplotlib provide powerful tools for numerical computing, data wrangling, and visualization, making Python an ideal choice for data scientists and analysts. The flexibility of Python allows for seamless integration with other languages, databases, and tools, facilitating a holistic approach to data science workflows. Its open-source nature and a vibrant community ensure continuous development and support, fostering a collaborative environment where knowledge is shared and solutions are readily available.
| PowerPoint PPT presentation | free to download

Big Data Market categories the Global Market By Types (Hardware; Software; Services; BDaaS - HaaS; Analytics; Visualization as Service); By Software (Hadoop, Big Data Analytics and Databases, System Software (IMDB, IMC) & by Geography
| PowerPoint PPT presentation | free to download
https://www.apponix.com/data-science-courses
| PowerPoint PPT presentation | free to download

Data Mining Versus Semantic Web ... used by SAS Enterprise Miner (Sample, Explore ... grouped into layers Page */65 Neuron Functionality I1 I2 I3 In Output W1 W2 ...
| PowerPoint PPT presentation | free to download

Enroll for Data Science training today. Request Demo class from Senior Data scientist. Our instructor has 12+ years of experience in Data Analytics & Data Science.
| PowerPoint PPT presentation | free to download
Data Science is the future of Artificial Intelligence. Therefore, it is very important to understand what is Data Science and how can it add value to your business.Data Science Training in Mumbai which includes classroom and online training. Along with Classroom training, we also conduct online training using state-of-the-art technologies to ensure the wonderful experience of online interactive learning. Data Science Training in Mumbai
| PowerPoint PPT presentation | free to download
Big data- it’s big, trending and the future of how world interprets and analyze. It is changing the way of how world uses raw data to transform into meaningful business information. Learn what big data has to offer along with standards and paradigms.
| PowerPoint PPT presentation | free to download
Data Mining Versus Semantic Web Veljko Milutinovic, vm@etf.bg.ac.yu http://galeb.etf.bg.ac.yu/vm DataMining versus SemanticWeb Two different avenues leading to the ...
| PowerPoint PPT presentation | free to download

Genpro provides clinical data visualization tools, dashboards and drill down reports to help sponsors to monitor their clinical and safety data. We can provide sponsors with web-based dashboards to monitor their clinical data including tabular and graphical reports from a single database or across multiple databases. Some of the data sources that we work with include EDC data records, Clinical data repositories, PK/PD data, Patient safety profiles along with real world events and outcomes.
| PowerPoint PPT presentation | free to download
Data Governance A common thread runs through in a vast number of business problems that most problem solvers cannot see Data that is not designed to be interoperable ...
| PowerPoint PPT presentation | free to download

data warehousing
| PowerPoint PPT presentation | free to download

With the increase in large chunks of data, the prominence of Data Science is also increasing. This requires many numbers of Data Scientists in the near future. Learn Data Science Online Training Course from our Experts and get On the Job support and we also offer guidance in Data science certification preparation. Get the professional Data Science online course and grab the best job. Learn Data Science online you will get all the right abilities to create a better career in Data Analytics Training.
| PowerPoint PPT presentation | free to download