
Data Art for the Networked Community - PowerPoint PPT Presentation
Title:
Data Art for the Networked Community
Description:
Data Art for the Networked Community – PowerPoint PPT presentation
Number of Views:106
Avg rating:3.0/5.0
Title: Data Art for the Networked Community
1
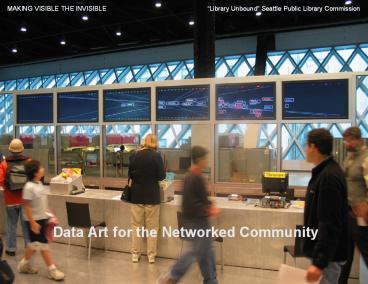
MAKING VISIBLE THE INVISIBLE
Library Unbound Seattle Public Library
Commission
- Data Art for the Networked Community
2
(No Transcript)
3
SPL Library Architectural InfraStructure
Transformations
- Rem Koolhaas radical redesign
- Open public research computerized spaces
- Spiral lay-out book storage stacks
- Wired librarians (offices turned into open
spaces) - RFID automated checkout and return sorting
4
Book Spiral Dewey Classification in a Continuous
Ribbon
5
Dewey Coded Floor Spiral
.jp
6
Automated RF System Check-in, Check-out
7
Librarians Set Loose Traded Office Space for
Commdevice
8
Visualizing the Collective Data Space The
Library As Data Exchange Center
9
Librarians Visualization
10
Making Visible the Invisible, a 10 year
Visualization Project 2004-2014
- For the next ten years Collect hourly
circulation of books, analyze the data, and
represent through visualizations - Data animations are featured on 6 large LCD
panels located on a glass wall horizontally
behind the librarians main information desk - in the Mixing Chamber, a large open 19,500 sq ft
space dedicated to information retrieval and
public accessible computer research.
11
Research Phase (fall 2003-spr 2005)
- 1 week residency to learn about the library, its
operations, etc. - Correlation is made between the flow of data
(books, DVD) leaving the library and what the
community of patrons considers interesting
information at any specific time. - The circulation of books is information that can
be calculated mathematically and represented
visually.
12
What are the Research Questions?
- Focus on the library as a Data Exchange Center
- Information in circulation Meaning to emerge out
of the organization of data - Emergence driven Local individual actions
(checking out books/dvds) add up to collective
positions representative of the communal
thinking! - How to transform the collecting and processing of
data into an aesthetic experience Emphasis on
narrative, metaphoric, associative expression - Visualizations Based on the organization of the
data, according to rule-based processes
13
Challenges Negotiating Data Access, Privacy,
Reliability
- Libraries other archival institutions are not
used to dynamic artworks that plug into their
system for data - Much negotiation with the IT sector for access to
data over long time - Obvious main concerns Security, privacy
protection, system integrity, virus protection,
maintenance, etc. - Reliability Issue Project has to be reliable,
self-sustaining for the next ten years
14
3 Related Previous Projects 1992-2001
- An Anecdoted Archive From the Cold War, 1992A
collection of historical personal objects
organized according to an invented classification
system (Floorplan) - Slippery Traces, 1995Navigation through 250
postcards (classified into 26 chapters) according
to multilayered rules inscribed in database
(picture within picture navigation links) - Pockets Full of Memories, 2001A dynamically
growing collection of artifacts with data sets
provided by the public. The objects are
dynamically self-organized in a 2D map
continuously creating a global order
15
Anecdoted Archive from the Cold War 1992
- A collection of historical personal objects
organized according to a hardwired
classification system Museum floorplan 8
rooms/chapters each with 6 to 12 stories each
story has mutiple narratives based on object
grouping
16
Slippery Traces 1995
- 250 postcards organized into 26 chapters.
Multilinear relational database structure
Navigation from image to image according to rules
inscribed in database with picture within picture
navigation links)
17
Pockets Full of Memories 2001-2006
- A dynamically growing collection of artifacts
provided by the public with data sets through a
questionnaire. The objects are dynamically
self-organized in a 2D Visualization map. Local
similarities emerging into a global order.
18
Phase I Concept Design Development (2003)
With Andreas Schlegel
- Visualizations experimentations Rapid
prototyping rough sketches focused on look and
feel of still animations - Dewey Decimal Classification system
- Online Tracking of Flow of data
http//128.111.221.74/parsing/index.php
19
(No Transcript)
20
Significant Area Digital Data Processing /
Management
- Basic method data collection -gt data
processing -gt visualization - Bulk of the work The data processing
in-between incoming data and the visualization - Data is received every 10 minutes (3000 per hour,
20000 transactions per day) - Operating for the next ten years (2014)
ltProcessinggt
InDATA
OutVISUALIZATION
21
Data Processing Metadata
- How by tracking the circulation of books/media
- Require Regular access to real-time data over
long time - Methods Calculations based on metadata
- All books media (cds, dvds, etc.) are RF tagged
- System tracks circulation automatically
- Metadata Catalog Num bibliography Num
date/time stamps collection code itemtype
barcode title callNumber Dewey class
keywords.
22
Dewey Classification System Ten topics each
subdivided into 100 subclasses
- 000 - Generalities100 - Philosophy
Psychology200 - Religion300 - Social
Science400 - Language500 - Natural Science
Mathematics600 - Technology Applied
Sciences700 - Arts800 - Literature900 -
Geography History - Untangling my chopsticks has the Dewey label
641.5952, (placed in the 641 Food drink
section)
23
Metadata in XML Format
- lttransactiongt
- ltitemNumbergt1531202lt/itemNumbergt
- ltbibNumbergt2180049lt/bibNumbergt
- ltckodategt2005-04-20lt/ckodategt
- ltckotimegt165500lt/ckotimegt
- ltckidategt2005-05-06lt/ckidategt
- ltckitimegt182100lt/ckitimegt
- ltcollcodegtnanflt/collcodegt
- ltitemtypegtacbklt/itemtypegt
- ltbarcodegt0010045801205lt/barcodegt
- lttitlegtUntangling my chopsticks, a culinary
sojourn in Kyotolt/titlegt - ltcallNumbergt641.5952 R358U 2003lt/callNumbergt
- ltdeweyClassgt641.5952lt/deweyClassgt
- ltsubjectsgt
- ltsubjectgtCookery Japaneselt/subjectgt
- ltsubjectgtJapanese tea ceremonylt/subjectgt
- ltsubjectgtKyoto Japan Social life and
customslt/subjectgt - ltsubjectgtFood habits Japan Kyotolt/subjectgt
- lt/subjectsgt
24
Phase II Visual Exploration System Planning
(2004) With August Black
- System, data storage discussions with SPL IT
- Experimentation with graphic visualizations
spectral pulses radar plots bezier/spirals,
Voronoi variations - Planning the datastructure its organization,
questions of what to look for, what patterns,
keywords?
25
Phase III System Architecture, Design
Production With Rama Hoetzlein
- July 2005 System Architecture Design and
production - Aug 2005 Data Flow Structure and Visualizations
(without access to real data) - Sept 5-12, 2005 Seattle Installation
- 1 week to install
- First realtime access to data
- Hardware/Software synchronization
- Interface with IT
26
Rama Hoetzlein System Development (summer/fall
2005)
- System overview (for continuous, large scale data
analysis and real-time visualization) - Data Analysis Overview
- Keyword Frequency Analysis
- Storing Data over time (10 years)
- Visualization Processes (Realtime graphics,
synchronizataion, data retrieval) - Network Data Flow (Server, clients, data
transfer) - Multiple Visualization Timing
- Visualization Management (Layered processes,
GameX interface)
27
Librarians Visualization
28
1 _Vital Statistics, Fall 2005
- The days and last hours circulation activities
- 1) Total items, 2) Dewey, 3) Non-Dewey, 4)
Books,5) DVD, 6) CDs and other media - Background color changes with time throughout day
- IMPACT Statistical overview, a form of clock at
glance
29
2 _Floating Titles Fall 2005
- Time based, linear stream of the last hours
titles, timestamped, spatialized (far, close),
and color coded (books, media) - IMPACT Sequence provides unexpected associations
30
3 _Dot Matrix Rain Fall 2005
- Non-Dewey titles fall from the top of screen
(gravity metaphor), Dewey titles pop up on screen - Finale Overall Dewey activity trace
- IMPACT Relational overview (for librarians)
between Dewey, non-dewey, books, and media.
31
4 _Keyword Map Attack Fall 2005
- Word Frequency Index of significant title words,
and Marc associated keywords, spatially plotted
according to Dewey order, color coded, based on
usage - IMPACT Maps topics of interests based on
keywords transcending Dewey categories
32
(No Transcript)
33
(No Transcript)
34
(No Transcript)
35
(No Transcript)
36
(No Transcript)
37
(No Transcript)
38
(No Transcript)
39
Front and Back Views of the Visualization
Installation
40
Challenges for a Ten Year Digital Media Arts
Project
- What to map to show Change Over time
- Search for patterns What exactly to look for?
- External correlation (news events)? relevant?
- Feedback How does the visualization impact on
circulation? - How do the librarians react to the visualized
information, and the participatory need of
technical support?
41
Review Evaluation Issues
- Best realization method Custom software design
defined by the task at hand - Collaborative Development requires a particular
mindset from participants - Technology changes every 3 years Long term
technological artwork requires maintenance
program and budget - Institution must be competent to feature and
willing to support technologally complex artworks
42
Credits
- Technical Design, Research Production
- Andreas Schlegel, Preliminary interaction Design,
website, data organization (2003-2004) - August Black, Preliminary data organization and
visualization, system administration (2004-2005) - Rama Hoetzlein/Mark Zifchock Team, Final
Engineering design, data organization, and
production (Summer 2005) - Sponsors
- Seattle Public Library
- Seattle Arts Commission
- Committee of 33, Seattle
- NSF IGERT multimedia Research
Recommended
CrystalGraphics Presentations


