
Run Charts - PowerPoint PPT Presentation
1 / 10
Title:
Run Charts
Description:
Kim I. Melton, 2005. Control Charts. A Run Chart with statistically calculated limits ... Kim I. Melton, 2005. Run Charts. If the process is stable all of ... – PowerPoint PPT presentation
Number of Views:149
Avg rating:3.0/5.0
Title: Run Charts
1
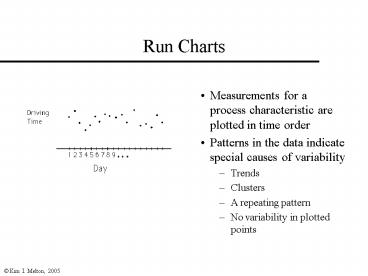
Run Charts
- Measurements for a process characteristic are
plotted in time order - Patterns in the data indicate special causes of
variability - Trends
- Clusters
- A repeating pattern
- No variability in plotted points
2
Control Charts
- A Run Chart with statistically calculated limits
- Limits are based on data collected from the
process - If points plot within the limits and show no
patterns, the process is said to be "in control"
or stable - If the process is considered stable, limits
represent the expected range of variation for the
value plotted - A process that is in control is predictable (it
may or may not be producing desirable output)
3
Setting Up Control Charts
- Step 1 Determine question(s) to be answered
- Step 2 Design data collection plan and collect
data - Step 3 Plot run chart and look for obvious
patterns - Step 4 If no patterns, calculate control limits
(using formulas for the appropriate type of
chart) - Step 5 Conduct runs tests
- Step 6 Interpret the chart
- Step 7 Determine appropriate type of action and
take steps to accomplish this
4
Control ChartsAttributes Data
- p or np charts
- "n" items are studied
- each item is classified in one of two categories
- we are counting the number in one of the
categories - a p chart plots the proportion in one category
- an np chart plots the number in one category
- c or u charts
- an inspection unit (IU) is defined
- the number of occurrences are counted and plotted
5
Control ChartsVariables Data
- X-bar and R charts (used together)
- X-bar (the average of n observations) attempts to
assess location - R (the range of n observations) attempts to
assess spread - X and Moving Range charts (used together)
- When there is no logical grouping, individual
values are plotted on the X chart - A moving range is used to assess spread
6
Determine characteristic to study
Counting or Measuring
counting
measuring
Attributes Data
Variables Data
Classifying into two categories?
How manyitems persubgroup?
no
yes
one
2 to 8
Constant subgroup size?
Constant area of opportunity?
ConsiderX/mR
yes
no
yes
no
Considernp or p
Considerp
Considerc
Consideru
7
Situations for Study
- Insurance Company Quote Lines
- Time to make quotes
- Nursing Home Meal Delivery Process
- Timeliness
- Complaints
- Mental Health Facility's Use of 11s
- Number of orders per week
8
Run Charts
- If the process is stable all of the following
will be true - Most points will plot near some central value
- Some variation will exist
- Individual points will not be predictable, but
the overall clustering of points will be
predictable - No patterns will show up
9
Runs Tests-Melton
- A control chart fails to show stabilityif any of
the following occur - at least one point plots outside the control
limits - two of three consecutive points in the same A
zone - fifteen consecutive points plot in the C zones
- more than seven consecutive points on the same
side of the center line - seven or more consecutive increases (or
decreases) - fifteen consecutive points alternating up and
down
Note Other runs tests are available in other
books.
10
LCL 6.386 CL 15.467UCL 24.547
Recommended
CrystalGraphics Presentations


