
Goal and scope definition - PowerPoint PPT Presentation
1 / 14
Title:
Goal and scope definition
Description:
Biotic resources deplection. LCI. results. Human Health. Biotic & abiotic ... Biotic & abiotic. manmade resources. Midpoint categories (environmental problems) ... – PowerPoint PPT presentation
Number of Views:1098
Avg rating:3.0/5.0
Title: Goal and scope definition
1
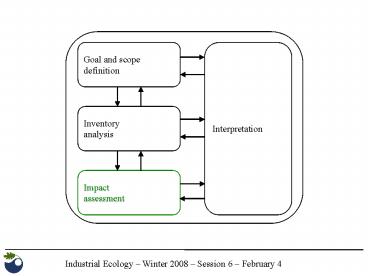
Goal and scopedefinition
Interpretation
Inventoryanalysis
Impactassessment
2
Life Cycle Impact Assessment
Impact Assessment is aimed at understanding and
evaluating the magnitude and significance of the
potential environmental impacts of a product
system (ISO14040).
Life Cycle Inventories (LCIs) by themselves do
not characterize the environmental performance
of a product system. Impact Assessment (IA) aims
at connecting, to the extent possible, emissions
and extractions listed in LCIs on the basis of
impact pathways to their potential environmental
damages.
Life Cycle Inventory results
Classification
Impact categories
Characterization
Category indicator results
Normalization
Environmental profile
Valuation
One-dimensional environmental score
3
Elements of LCIA according to ISO 14044
Mandatory elements
Selection of impact categories, category
indicators and characterization models
Assignment of LCI results to impact categories
(classification)
Calculation of category indicator results
(characterization)
Category indicator results (LCIA profile)
Optional elements Normalization of category
indicator results relative to reference
information Grouping Weighting Data quality
analysis
4
Impact Assessment The environmental mechanism
(impact pathway)
Impact pathways consist of linked environmental
processes, and they express the causalchain of
subsequent effects originating from an emission
or extraction (environmental intervention).
Examples
Increase in effectiveness of communication of
results (generally)
SO2 emissions
Acidrain
Acidifiedlake
Dead fish
Loss ofbiodiversity
Source
Midpoint
Endpoint
CFC emissions
Tropospheric OD
Stratospheric OD
UVBexposure
Humanhealth
Increase in uncertainty for predicting the
environmental impact from the initial
interventions
5
Impact Assessment Impact Categories
According to ISO14044, LCI results are first
classified into impact categories that are
relevant and appropriate for the scope and goal
of the LCA study.
Example
Carbon dioxide
Climate change
Methane
Stratospheric ozone depletion
CFCs
Photochemical oxidant formation
Nitrogen oxides
Sulphur dioxide
Acidification
- A category indicator, representing the amount of
impact potential, can be located at any place
between the LCI results and the category
endpoints. There are currently two main Impact
Assessment methods - Problem oriented IA methods stop quantitative
modeling before the end of the impact pathway
and link LCI results to so-defined midpoint
categories (or environmental problems), like
acidification and ozone depletion. - Damage oriented IA methods, which model the
cause-effect chain up to the endpoints or
environmental damages, link LCI results to
endpoint categories.
6
Impact AssessmentImpact categories proposed by
UNEP/SETAC Life Cycle Initiative in 2003
Midpoint categories (environmental problems)
Endpoint categories (environmental damages)
Photochemical oxidant formation
Human toxicity
Human Health
Ozone depletion
Climate change
Biotic abiotic natural environment
Acidification
LCI results
Eutrophication
Biotic abiotic natural resources
Ecotoxicity
Land use impacts
Biotic abiotic manmade resources
Species organism dispersal
Abiotic resources deplection
Missing Casualties Noise
Biotic resources deplection
Source Int J of LCA 9(6) 2004
7
Impact AssessmentClassification and
characterization
- How to operationalize classification and
characterization - for a chosen impact category, identify one or
more category endpoints - define a suitable category indicator
- identify those LCI results that contribute to
the indicator - choose characterization model and
characterization factor
Characterization model
The chain of physical, chemical and biological
events in the natural environmentthat link a
particular elementary flow to a particular impact
category is called environmental process. For
each impact category, the characterization model
models all relevant environmental processes (to a
greater or lesser extent).
8
Impact AssessmentClassification and
characterization
Example
In general
LCI results
Cd, CO2, NOX, SO2, etc. (kg/functional unit)
Impact category
Acidification
LCI results assigned to Impact category
NOX, SO2, etc. (kg/functional unit)
Characterization model
Category indicator results
Proton release (H aq)
- Forest
- Vegetation
- etc.
Category endpoint(s)
Source ISO14044
9
Impact AssessmentClassification and
characterization Example 1
Impact category Climate change LCI
results Emissions of greenhouse gases to the air
(in kg) Characterization model the model
developed by the IPCC defining the global
warming potential of different gases Category
indicator Infrared radiative forcing
(W/m2) Characterization factor Global warming
potential for a 100-year time horizon
(GWP100) for each GHG emission to the air
(in kg CO2 equivalents/kg emission) Unit of
indicator result kg (CO2 eq)
Substance GWP100 (in kg CO2 equivalents/kg
emission) Carbon dioxide 1 Methane 21 CFC-11
4000 CFC-13 11700 HCFC-123 93 HCFC-142b 2000 P
erfluoroethane 9200 Perfluoromethane 6500 Sulphu
r hexafluoride 23900
Source (Guinée et al., 2002)
10
Impact AssessmentClassification and
characterization Example 2
Impact category Stratospheric ozone
depletion LCI results Emissions of ozone
depleting gases to the air (in kg) Characterizatio
n model The model developed by WMO, defining the
ozone depletion potential of different
gases Category indicator Stratospheric ozone
breakdown Characterization factor Ozone depletion
potential in the steady state (ODP8) for each
emission (in kg CFC-11 equivalents/kg
emission) Unit of indicator result kg (CFC-11 eq)
Substance ODP8 (in kg CFC-11 equivalents/kg
emission) Halon-1301 12 Halon-1211 5.11 Halon-12
02 1.25 Tetrachloromethane 1.2 CFC-11 1 CFC-12
0.82 HCFC-123 0.012 HFC-142b 0.043 Methyl
Bromide 0.37
Source (Guinée et al., 2002)
11
Impact AssessmentClassification and
characterization Example 3
Impact category Acidification LCI
results Emissions of acidifying substances to
the air (in kg) Characterization model RAINS10
model, developed by IIASA, describing the fate
and deposition of acidifying substances,
adapted to LCA Category indicator Deposition/acidi
fication critical load Characterization
factor Acidification potential (AP) for each
acidifying emission to the air (in kg SO2
equivalents/kg emission) Unit of indicator
result kg (SO2 eq)
Substance AP (in kg SO2 equivalents/kg
emission) ammonia 1.88 hydrogen
chloride 0.88 hydrogen fluoride 1.60 hydrogen
sulfide 1.88 nitric acid 0.51 Nitrogen
dioxide 0.70 Nitrogen monoxide 1.07 Sulfur
dioxide 1.00 Sulphuric acid 0.65
Source (Guinée et al., 2002)
12
Life cycle inventory (LCI)
13
Classification
Characterization
Impact Categories
LCI
Indicator results
Characterization factors
20kg CO2
Climate change
GWP
82kg CO2 eq
2kg Methane
0.005kg CFC-11 eq
Stratospheric ozone depletion
ODP
5g CFC-11
Photochemical oxidant formation
POCP
0.068kg ethylene eq
2kg NO2
AP
2.4kg SO2 eq
1kg SO2
Acidification
14
Reading for Wednesday, 6 February Guinée J B
(Ed.) (2002) Handbook on Life Cycle Assessment,
Operational Guide to the ISO Standards, Kluwer,
Dordrecht, The Netherlands Part 3 Scientific
Background, Chapter 4 Impact Assessmentpp
136-147 Sections 4.1 and 4.2 pp 241-252
Sections 4.4 to 4.8 Life cycle assessment of
disposable and reusable nappies in the UK,
Environment Agency, Bristol, UK, 2005pdf
available on course websitehttp//www.bren.ucsb.
edu/academics/course.asp?number282
Recommended
CrystalGraphics Presentations


