
Mean, Variance, and Standard Deviation for the binomial distribution - PowerPoint PPT Presentation
1 / 6
Title:
Mean, Variance, and Standard Deviation for the binomial distribution
Description:
You presume that people are evenly split (50/50) on their preference between two ... Alternatively, using our presumed 50/50 preference, find mean=40, stddev=4.5. ... – PowerPoint PPT presentation
Number of Views:611
Avg rating:3.0/5.0
Title: Mean, Variance, and Standard Deviation for the binomial distribution
1
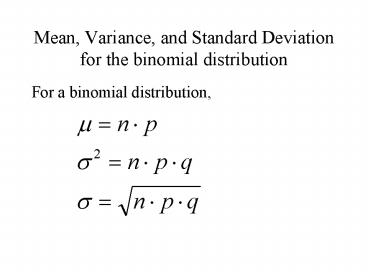
Mean, Variance, and Standard Deviationfor the
binomial distribution
- For a binomial distribution,
2
Example
- Randomly guessing on a 100 question
multiple-choice test, where each question has 4
possible answers,
3
Example
- Using our range rule of thumb,
It would be unusual to get less than 17 questions
correct, or more than 33 question correct if you
were randomly guessing on the test.
4
Another Example
- You presume that people are evenly split (50/50)
on their preference between two candidates. You
poll 80 people, and find 45 prefer candidate A.
Is this unexpected? - We could find P(45 or more).
- Alternatively, using our presumed 50/50
preference, find mean40, stddev4.5. This
suggests that outcomes of 31 to 49 would be usual
occurrences. Since 45 falls in that range, we
shouldnt consider it unusual.
5
Another Example
- Now suppose you poll 800 people, and 450 prefer
candidate A. Is this unexpected? - Using our presumed 50/50 preference, mean 400,
stddev 14.1. Again using the range rule of
thumb, this suggests that outcomes of 372 to 428
would be usual. - Since the outcome of 450 is unusual, we should
question whether our presumption of a 50/50 split
is accurate.
6
Homework
- 4.4 1, 5, 7, 11, 13
Recommended
CrystalGraphics Presentations


