
Strength of Association - PowerPoint PPT Presentation
1 / 13
Title:
Strength of Association
Description:
'Strength of Association. What is the difference between a ... Others available: Kendall's tau (t); Somer's d (less frequently used) Rank-order statistics: ... – PowerPoint PPT presentation
Number of Views:62
Avg rating:3.0/5.0
Title: Strength of Association
1
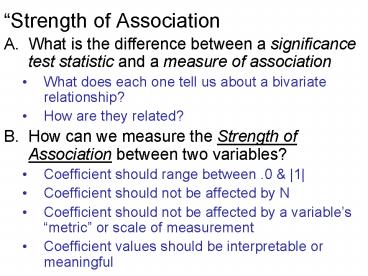
Strength of Association
- What is the difference between a significance
test statistic and a measure of association - What does each one tell us about a bivariate
relationship? - How are they related?
- How can we measure the Strength of Association
between two variables? - Coefficient should range between .0 1
- Coefficient should not be affected by N
- Coefficient should not be affected by a
variables metric or scale of measurement - Coefficient values should be interpretable or
meaningful
2
Strength of Association (cont.)
- What does bivariate association mean?
Generally reflects two distinct ideas - Covariance or co-occurrence between variables
(versus independence) - Measures of agreement or covariance
- Predictability of one variable from the other
(versus randomness) - Proportional Reduction of Error (PRE) Measures
- A number of different measures of association
- Based on different levels of measurement
- Based on different logical models criteria
3
Strength of Association (continued)
- Association between 2 numerical variables ?
Covariance Correlation - Coefficient of Association Pearsons r
- r-squared proportion of variance in common
- May use Spearmans r if data are ranked
- Association between 1 categoric variable and 1
numeric variable ? ANOVA mean differences
(F-tests and t-tests) - Coefficient of Association eta (?)
- eta-squared proportion of variance between
groups
4
Strength of Association (continued)
- Association between 2 categoric variables ?
Ordinal or Nominal - Approaches to nonparametric measures of
association ? (a) Chi-square-based (b) PRE (c)
Concordance/agreement - Nominal (unordered) variables
- Chi-square-derived
- Contingency coefficient, C
- Cramers V coefficient ? use this for 2x3 or
larger - Phi coefficient, F ? use this for 2x2 tables
- PRE-derived
- Lambda (asymmetric)
5
Strength of Association (continued)
- Association between 2 categoric variables
(continued) - Ordinal (ordered) variables
- Concordance-based statistics
- Gamma, ? ? most commonly used
- Others available Kendalls tau (t) Somers d
(less frequently used) - Rank-order statistics
- Use only if many categories few ties (i.e.,
cases with the same value on a variable) - Can also use Chi-square-based measures
6
Strength of Association (continued)
- Categoric Measures A Summary
- Nominal variables
- Phi, F for 2x2 tables
- Kramers V for larger than 2x2 tables
- Ordinal variables
- Gamma, ? ? most commonly used
- Yules Q ? same statistic in a 2x2 table
- Use rank-order statistics (Spearmans r) only if
many values few ties - Can also use Phi and Kramers V
7
Strength of Association (continued)
- Categoric measures of association
- Different coefficients will generally not yield
the same values on the same crosstab - Gamma ( Yules Q) will almost always compute
higher values than Kramers V ( Phi) on the same
tables
8
Strength of Association (continued)
- Categoric measures of association
- How to Compute them?
- By Hand see formulas in the textbook
- Chi-square-based easiest to compute
- Note special computing formulas for 2x2 tables
- Note X Y variables in crosstab must be
formatted in the same direction for ordinal-level
statistics (e.g., Gamma) - In SPSS Click statistics box in Crosstabs
pop-up menu, then select appropriate coefficients
(do not select them all)
9
(No Transcript)
10
(No Transcript)
11
Strength of Association (continued)
- Going beyond bivariate analysis to multivariate
analyses - We often wish to consider more than two variables
at a time because other variables may be involved
in more complex patterns - Termed Partialling or controlling ?
statistically consider the confounding influence
of additional variables (3rd variable problem) - This invokes the concept of Ceteris paribus
(holding everything else equal)
12
Strength of Association (continued)
- Going beyond bivariate analysis to multivariate
analyses - Partialling or controlling ? statistically
consider the confounding influence of additional
variables (3rd variable problem) - In cross-tabulations, this means nesting the
crosstabs within the 3rd variable - i.e., compute separate sub-crosstabs within
levels of the 3rd variable - See the example on the handout
13
Strength of Association (continued)
- Going beyond bivariate analysis to multivariate
analyses - Partialling or controlling ? statistically
consider the confounding influence of additional
variables (3rd variable problem) - In cross-tabulations, this means nesting the
crosstabs within the 3rd variable - i.e., compute separate sub-crosstabs within
levels of the 3rd variable - See the example on the handout
- Only useful when 3rd variable is associated with
both X and Y variables.