
Special Functions - PowerPoint PPT Presentation
1 / 18
Title:
Special Functions
Description:
Example 6-1b. Solve Use the pattern of times and costs to make a table, where x is the number ... shape, but different y-intercepts. The graph of g (x) is the ... – PowerPoint PPT presentation
Number of Views:47
Avg rating:3.0/5.0
Title: Special Functions
1
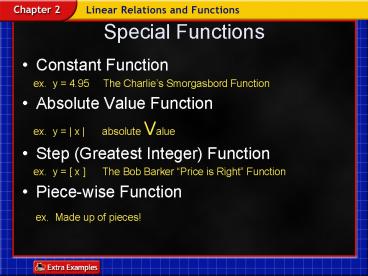
Special Functions
- Constant Function
- ex. y 4.95 The Charlies Smorgasbord
Function - Absolute Value Function
- ex. y x absolute Value
- Step (Greatest Integer) Function
- ex. y x The Bob Barker Price is
Right Function - Piece-wise Function
- ex. Made up of pieces!
2
Lesson 6 Contents
Example 1 Step Function Example 2 Constant
Function Example 3 Absolute Value
Functions Example 4 Piecewise Function Example
5 Identify Functions
3
Example 6-1a
Psychology One psychologist charges for
counseling sessions at the rate of 85 per hour
or any fraction thereof. Draw a graph that
represents this solution.
Explore The total charge must be a multiple of
85, so the graph will be the graph of a step
function. Plan If the session is greater than 0
hours, but less than or equal to 1 hour, the cost
is 85. If the time is greater than 1 hour, but
less than or equal to 2 hours, then the cost is
170, and so on.
4
Example 6-1b
Solve Use the pattern of times and costs to
make a table, where x is the number of hours of
the session and C(x) is the total cost. Then draw
the graph.
5
Example 6-1c
Examine Since the psychologist rounds any
fraction of an hour up to the next whole number,
each segment on the graph has a circle at the
left endpoint and a dot at the right endpoint.
6
Example 6-1d
Sales The Daily Grind charges 1.25 per pound of
meat or any fraction thereof. Draw a graph that
represents this situation.
7
Example 6-2a
8
Example 6-2b
9
Example 6-3a
Find several ordered pairs for each function.
10
Example 6-3b
Graph the points and connect them.
Answer
- The domain of both graphs is all real numbers.
- The graphs have the same shape, but different
x-intercepts. - The graph of g (x) is the graph of f (x)
translated left 5 units.
11
Example 6-3c
12
Example 6-4a
13
Example 6-4b
14
Example 6-4c
15
Example 6-4d
16
Example 6-5a
Determine whether the graphrepresents a step
function, a constant function, anabsolute value
function, or a piecewise function.
Answer Since this graphconsists of
differentrays and segments, it is a
piecewisefunction.
17
Example 6-5b
Determine whether the graphrepresents a step
function, a constant function, anabsolute value
function, or a piecewise function.
Answer Since this graph is V-shaped, it is an
absolute value function.
18
Example 6-5c
Answer absolute valuefunction
Answer constant function
Recommended
CrystalGraphics Presentations


