
Fiscal Policy - PowerPoint PPT Presentation
Title:
Fiscal Policy
Description:
An A-Level presentation describing UK fiscal policy. While it does deal with the major themes it focuses on the data to do with tax and spending and the effect of these taxes. – PowerPoint PPT presentation
Number of Views:3730
Title: Fiscal Policy
1
Fiscal Policy
2
Specification
- 3.4.2 Managing the National Economy
- Fiscal Policy
- Candidates should be able to discuss the issue of
the budget balance and be able to evaluate the
possible economic consequences of a budget
deficit or budget surplus and the possible
corrective measures. - They should be able to assess the economic
significance of changes in the level and
distribution of public expenditure. - They should be able to analyse and evaluate the
microeconomic significance of taxation and the
various roles and relative merits of the
different UK taxes. - There should be an awareness of the taxation
principles which are likely to underlie a
taxation system, such as the ability to pay and
the impact on incentives. - There should be an awareness of the introduction
of fiscal rules - the UK Code for Fiscal Stability
- Stability and Growth Pact within the euro area.
Topic Reading Lawrence and Stoddard Chapter
14 Due Day 3 P4
3
What is Fiscal Policy?
- Tax and Spending decisions aiming to help the
government meet its Macroeconomic targets - Which of the following are NOT examples?
- Removing Stamp Duty for first time buyers
- Quantitative easing
- Decreasing unemployment benefit to encourage
people into work. - Raising income tax to reduce AD
- Reducing interest rates to stimulate AD
4
Govt Receipts
Labels
Income Tax
Council Tax
National Insurance
Corporation Tax
VAT
Excise Duties
Business Rates
Other
Source 2008 PBR
5
Tax Income changes over time
Source http//www.guardian.co.uk/news/datablog/20
10/apr/25/tax-receipts-1963
6
Historical Rates
Year Chancellor Starting rate of Income Tax Basic Rate Top Rate VAT
1985 Lawson 30 60 15
1986 Lawson 29 60 15
1987 Lawson 27 60 15
1988 Lawson 25 40 15
1989 Lawson 25 40 15
1990 Major 25 40 15
1991 Lamont 25 40 17.5
1992 Lamont 20 25 40 17.5
1993 Lamont 20 25 40 17.5
1994 Clarke 20 25 40 17.5
1995 Clarke 20 25 40 17.5
1996 Clarke 20 24 40 17.5
1997 March Clarke 20 23 40 17.5
1997 (May)Comp Brown 20 23 40 17.5
1988 Brown 20 23 40 17.5
1999 Brown 10 23 40 17.5
2000 Brown 10 22 40 17.5
2001 Brown 10 22 40 17.5
2002 Brown 10 22 40 17.5
2003 Brown 10 22 40 17.5
2004 Brown 10 22 40 17.5
2005 Brown 10 22 40 17.5
2006 Brown 10 22 40 17.5
2007 Darling 10 22 40 17.5
2008 Darling 20 40 17.5
2009 Darling 20 40 15
2010 Darling 20 40 60 17.5
Source Compiled by Nick Jones and Matt Pringle
7
Why do we tax?
- Fund Government Spending
- Influence Macroeconomic Performance
- Redistribute income
- Correct Market Failure
8
What makes a good tax?
- Economical
- Equitable
- Horizontal
- Vertical
- Effective
- Convenient
- Certain
- Flexible
9
How do we Categorise Taxes?
- Direct Tax
- Indirect Tax
- May be better at changing behaviour
- Good for correcting market failure (Pigouvian
taxation) - Less impact on no. Of hours worked ( work leisure
trade ) - People can chose not to pay them by not
purchasing the good/service.
- May be inflationary
- Could create a black market
- May constitute a hidden tax
- May be regressive
10
How Progressive is the UK Tax System?
Who Pays? Taxes can be classified by who pays
the most Progressive The rich pay a greater
proportion of their income Proportional
Everyone pays the same proportion of their
income Regressive The poor pay a greater
proportion of their income
11
How Progressive is the UK Tax System?
12
How Progressive is the UK Tax System?
13
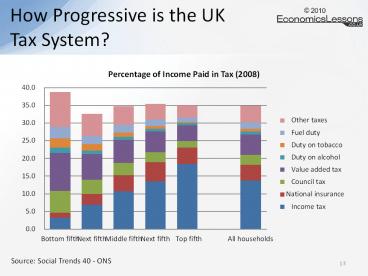
How Progressive is the UK Tax System?
Source Social Trends 40 - ONS
14
How Progressive is the UK Tax System?
How Progressive has the UK been? Much more
Progressive than now. In 1978 the top band of
income tax was 83 and 98 for investment income.
Now there is only a 15 difference between the
tax paid by the top and bottom quintiles. In
more recent years, the Conservatives began to
improve progressivity towards the end of their
time in power a trend that Labour continued but
only very slightly before reducing the
progressiveness of the tax system before the end
of their time in office.
Source Richard Blundell -Empirical Evidence and
Tax Policy Design Lessons from the Mirrlees
Review
15
Government Spending
Source PBR 2008 HM Treasury
16
Historical Govt Expenditure (bn)
Source Compiled from PBRs
17
Government Budget
- The budget can be
- In Surplus Income is greater than expenditure
- Balanced Income is the same as expenditure
- In Deficit Income is less than expenditure
- A Deficit can be
- Cyclical Because of the stage of the business
cycle - Structural Because of the government is spending
unsustainably
18
Historical Budget Position (bn)
Source Compiled from PBRs
19
Expenditure and Receipts ( GDP)
Source Compiled from PBRs
20
Is a Deficit a Problem
- Yes
- No
- Fiscal Rules
- Borrowing over cycle is only to fund investment
- Public Sector Debt max 40 GDP
- Growth and Stability Pact
- Crowding out/Risk of higher inflation
- Interest repayment (and sensitivity to rates)
- Investment spending will generate future returns.
- Inflation gradually erodes the national debt.
- Government usually finds it easy to borrow.
21
UK Deficit
- http//www.debt-clock.org/
22
Limitations of Fiscal Policy
- Laffer Curve
- Changing pattern of demand
- Changing investment
- Do fiscal stimuli work at all?
- Time lags
Recommended
CrystalGraphics Presentations


