
TROPOSPHERIC OZONE CHEMISTRY: A DETAILED ANALYSIS - PowerPoint PPT Presentation
1 / 61
Title:
TROPOSPHERIC OZONE CHEMISTRY: A DETAILED ANALYSIS
Description:
obs = black; model strat = green; model total = red ... Reliability of air quality models (e.g. local vs transported NOx/HC/O3) ... – PowerPoint PPT presentation
Number of Views:200
Avg rating:3.0/5.0
Title: TROPOSPHERIC OZONE CHEMISTRY: A DETAILED ANALYSIS
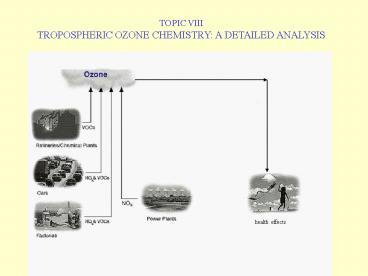
1
TOPIC VIII TROPOSPHERIC OZONE CHEMISTRY A
DETAILED ANALYSIS
health effects
2
GENERAL DESCRIPTION OF TROPOSPHERIC CHEMISTRY
- Trop. chem. is characterized by reaction cycles
- OH plays a key role in tropospheric chemistry
- Rxns. lead to removal as well as generation of
pollutants
3
SOURCE OF TROPOSPHERIC OH
- Photolysis of O3, followed by the reaction of a
small - fraction of the resulting O(1D) atoms with water
vapor
O2
O3
Solar radiation, wavelength 300-320 nm
O(3P)
O2, N2
2OH
O(1D)
H2O
4
O3 PHOTOLYSIS RATE CONSTANT
5
STRATOSPHERIC SOURCE OF TROPOSPHERIC O3
- O3 chemical production in stratosphere followed
- by downward transport to the troposphere
O2
Solar radiation, (
Strat. chem. destruction
Solar radiation (
O(3P)
O3
O2
Transport to trop.
6
A SIMPLE BUDGET ANALYSIS OF TROPOSPHERIC OH
O3 flux from stratosphere to troposphere 1-2
x 1013 moles y-1 max. OH source 2-4 x 10¹³
moles y-1 Global CO source 6-10 x 1013 moles
y-1 Global CH4 source 3 x 10¹³ moles y-1 If
no other sources, OH would be titrated
chemical recycling of OH consumed, and additional
OH production from tropospheric chemical
production of O3
7
CO OXIDATION CYCLE O3 PRODUCTION
solar radiation, O2
O3
NO2
NO
CO2
OH
HO2
O2
CO
Net CO 2O2 -- CO2 O3 Catalytic role of NOx
(NO NO2) in recycling HO2 to OH Coupling
between OH and HO2 (HOx)
8
CO OXIDATION CYCLE O3 DESTRUCTION
O3
2O2
CO2
OH
HO2
O2
CO
Net CO O3 -- CO2 O2
9
CO OXIDATION CYCLE O3 PRODUCTION vs DESTRUCTION
- For rxn. system considered
- O3 production/destruction if HO2 reacts with
NO/O3 - O3 production if
- kHO2NO nHO2 nNO kHO2O3 nHO2 nO3
- kHO2NO nNO kHO2O3 nO3
- nNO/nO3 kHO2O3/kHO2NO
- kHO2O3/kHO2NO 2.3 x 10⁻⁴ at 298 K
- O3 25-50 ppb at surface
- ? nNO 6-12 ppt
10
CO OXIDATION CYCLE
solar radiation, O2
O3
NO2
NO
CO2
OH
HO2
O2
CO
H2O2
solar rad.
HO2 O3 also serves to recycle HO2 to OH H2O2
formation and photolysis also serves to recycle
HO2 to OH But not all HO2 is recycled H2O2 OH
-- HO2 H2O
11
CO OXIDATION CYCLE
solar radiation, O2
O3
NO2
NO
HNO3
CO2
wet dep
OH
HO2
O2
CO
H2O2
solar rad.
wet dep
Removal of soluble radical reservoirs by wet and
dry deposition
12
METHANE OXIDATION CYCLE (HIGH NOX)
- CH4 OH -- CH3O2 H2O
- CH3O2 NO -- CH3O NO2
- CH3O O2 -- HCHO HO2
- HCHO solar radn. -- HCO HO2
- HCO O2 -- CO HO2
- CO OH -- CO2 HO2
- 4(HO2 NO -- OH NO2)
- 5(NO2 solar radn. -- NO O3)
- Net CH4 5O2 -- CO2 2OH 5O3 H2O
- O3 and HOx production
O2
O2
O2
branching reaction
O2
O2
13
METHANE OXIDATION CYCLE (NO NOX)
- CH4 OH -- CH3O2 H2O
- CH3O2 HO2 -- CH3OOH O2
- CH3OOH OH -- HCHO OH H2O
- HCHO OH -- HCO H2O
- HCO O2 -- CO HO2
- CO OH -- CO2 HO2
- Net CH4 3OH 2O2 -- CO2 3H2O HO2
- No O3 production and HOx consumption
O2
O2
14
ROLE OF NOX IN O3 CHEMICAL PRODUCTION
- Cycling of HOx (OH HO2) by NOx vs. radical
termination reactions - Too little NOx Radical termination (e.g. HO2
HO2) rather than radical cycling (e.g. HO2 NO)
leading to O3 chemical destruction - Too much NOx Radical termination by alternate
route (e.g. OH NO2) as well as short-term O3
destruction by NO O3 -- NO2 implications
for O3 peak downwind of strong NOX sources
15
NATURAL SOURCES OF TROPOSPHERIC NOX
- Significant contribution of fertilizer-induced
emissions to - biogenic NOx sources
- Input from the stratosphere
16
ANTHROPOGENIC SOURCES OF TROPOSPHERIC NOX
- Large surface-based anthropogenic sources
17
GLOBAL DISTRIBUTION OF NOX EMISSIONS
18
CHEMICAL LIFETIME OF NOX IN THE TROPOSPHERE
- NOx chemical lifetime of the order of days in
the troposphere
19
SCHEMATIC OF NOy CHEMISTRY IN THE TROPOSPHERE
org. peroxynitrates
org. nitrates
inorg. nitrates
, T
NOx
nitrous acid
nitrogen pentoxide
pernitric acid
- Complex chemistry involving inorganic and
organic radicals
20
SIMPLIFIED SCHEMATIC OF NOy CHEM. IN THE TROP.
org. radicals
OH dark rxns.
NOx
PAN
HNO3
thermal decomp.
h?, OH
emissions
dry deposition
dry wet deposition
dry deposition
- Org. peroxynitrate reservoir (PAN i.e.
CH3C(O)O2NO2) - sequesters NOx and facilitates long
range-transport - Inorg. nitrate reservoir (HNO3) facilitates
- removal of NOx
21
MODELED DISTRIBUTION OF NOx IN THE TROPOSPHERE
- Strong gradients near surface, more zonally
uniform at alt. - ppb levels in polluted regions, ppt levels in
background trop.
22
DOMINANT CONTRIBUTORS OF NOx IN THE TROP.
- Complex picture of trop. NOx with strong anthro.
impact
23
SURFACE O3 AT SELECTED STATIONS
41 S
47 N (3.6 km)
34 S
53 N
obs black
19 N (3.4 km)
14S
- Spring max. at clean NH sites, broad
spring-summer max. at - Jungfraujoch lower values winter-spring max
in SH
24
O3 AT 700 200 hPa AT SELECTED STATIONS
TATENO 36N
BOULDER 40N
HOHENP. 47N
EDMONTON 53N
RESOLUTE 74N
obs black
- 200 hPa ? spring max. 700 hPa ? spring max. at
high lat., - broad spring-summer max. at mid lat. (double
peak at Tateno)
25
SURFACE O3 AT SELECTED STATIONS
41 S
47 N (3.6 km)
34 S
53 N
obs black model strat green model trop
dashed green model total red
19 N (3.4 km)
14S
- Spring max in STE in NH generally earlier than
O3 max - Large contribution of O3 produced in the
troposphere
26
O3 AT 700 200 hPa AT SELECTED STATIONS
TATENO 36N
BOULDER 40N
HOHENP. 47N
EDMONTON 53N
RESOLUTE 74N
obs black model strat green model total
red
- Spring max in STE in NH generally earlier than
O3 max - Large contribution of O3 produced in the
troposphere
27
MODELED GROWING-SEASON MAY-AUGUST O3
1860
1993
2025
28
CONTRIB. OF NOX SOURCES TO 1993 O3
29
PROJECTED CONTRIB. OF NOX SOURCES TO 2025 O3
30
SOURCES OF O3 PRECURSORS
31
GLOBAL BUDGET OF O3
32
MODELED PRE-INDUSTRIAL vs PRESENT CO NOx
- Significant increases due to anthropogenic
activities
33
MODELED PRE-INDUSTRIAL vs PRESENT OH O3
- Increase in O3 and regionally-varying
increase/decrease in OH
34
MODELED CHANGES FROM PRE-IND. TO PRESENT
- Strong enhancement of NOx and O3 in NH lower
trop., more - vertically uniform enhancment of CO
- C of OH in NH lower trop., and decrease in
- middle and upper trop.
35
POLLUTION AND CROP PRODUCTION
- 75 of worlds
- consumption of energy
- and fertilizers
- 60 of worlds food
- crop production and
- food exports
36
EFFECT OF O3 ON CROPS
37
MODELED GROWING-SEASON1 MEAN O3 (ppbv) PRESENT-DAY
HARVARD
NCAR
GFDL
- Elevated O3 in CS-MAPS
- Significant model-to-model
- differences
1. 23S-90S Nov-Feb 23N-90N May-Aug 23S-23N
All year
38
CURRENT vs IPCC 2100 A2 SCENARIO ANTHROPOGENIC
NOx EMISSIONS
YEAR 1990 (31 Tg N/year)
YEAR 2100 (109 Tg N/year)
(ktons N year-1 degree-2)
39
HARVARD MODEL CURRENT vs IPCC YEAR 2100 A2
SCENARIO GROWING-SEASON MEAN O3 (ppbv)
- Significant projected changes
- in surface O3
- Mean concentrations 75 ppbv
- over most of CS-MAPS
- large areas in tropics and subtropics
40
CUMULATIVE PERCENTAGES
CROPS
- Large uncertainty in crop exposure to O3
pollution 0-20 of crops in areas - with growing-season mean O3 50 ppbv
- Potentially large impact in future years using
year 2100 IPCC A2 scenario from - HARVARD model 50 of crops in areas with
growing season mean O3 70 ppbv
41
1998 Measured Surface Ozone Concentrations
2nd highest daily max 1-hr (ppb)
169
153
65-124
125-164
118
205-404
165-204
4th highest daily max 8-hr (ppb)
167
155
141
85-104
65-84
105-124
125-374
36
1998 EPA National Trends Report
42
U.S. SOURCES OF O3 PRECURSORS
NOx
CO
Anthro. total 24 M tons Biogenic 1.5 M tons
Anthro. total 89 M tons
VOC
Anthro. total 18 M tons Biogenic 28 M tons
43
SCHEMATIC OF O3 POLLUTION CHEMISRY
- O3 hv ? O2 O(1D)
- 2. O(1D) M ? O M
- 3. H2O O(1D) ? 2OH
- 4. RH OH ? RO2 H2O
- 5. RO2 NO ? RO NO2
- 6. RO O2 ? RCHO HO2
- 7. HO2 NO ? OH NO2
- 8. HO2 HO2 ? H2O2 O2
- 9. OH NO2 M ? HNO3 M
Hydrocarbon reactivity increases with size and
number of double bonds
O2
Photolyzes to produce O3 via NO2 hv ? NO O3
O2
can photolyze (chain branching) or react with OH
(chain propogation)
44
SCHEMATIC OF O3 POLLUTION CHEMISRY
- O3 hv ? O2 O(1D)
- 2. O(1D) M ? O M
- 3. H2O O(1D) ? 2OH
- 4. RH OH ? RO2 H2O
- 5. RO2 NO ? RO NO2
- 6. RO O2 ? RCHO HO2
- 7. HO2 NO ? OH NO2
- 8. HO2 HO2 ? H2O2 O2
- 9. OH NO2 M ? HNO3 M
O2
Net rxns 1-7 RH 4O2 ? RCHO 2O3 H2O
45
SCHEMATIC OF O3 POLLUTION CHEMISRY
- O3 hv ? O2 O(1D)
- 2. O(1D) M ? O M
- 3. H2O O(1D) ? 2OH
- 4. RH OH ? RO2 H2O
- 5. RO2 NO ? RO NO2
- 6. RO O2 ? RCHO HO2
- 7. HO2 NO ? OH NO2
- 8. HO2 HO2 ? H2O2 O2
- 9. OH NO2 M ? HNO3 M
Chain propogation is efficient Rates 4, 5, 6, and
7 are equal Production rate of O3 PO3k5nRO2nNO
k7nHO2nNO 2k7nHO2nNO Prodn. of OH by
7 balanced by loss of OH by 4 nOH
(k7nHO2nNO/k4nRH)
O2
46
SCHEMATIC OF O3 POLLUTION CHEMISRY
- O3 hv ? O2 O(1D)
- 2. O(1D) M ? O M
- 3. H2O O(1D) ? 2OH
- 4. RH OH ? RO2 H2O
- 5. RO2 NO ? RO NO2
- 6. RO O2 ? RCHO HO2
- 7. HO2 NO ? OH NO2
- 8. HO2 HO2 ? H2O2 O2
- 9. OH NO2 M ? HNO3 M
Production rate of O3 PO3k5nRO2nNO k7nHO2nNO
2k7nHO2nNO Prodn. of OH by 7 balanced
by loss of OH by 4 nOH (k7nHO2nNO/k4nRH) Low
NOX ? HOx loss is rxn. 8 PHOx 2k8(nHO2)2 PO3
2k7(PHOx/2k8)1/2nNO Linear dependence on
NOx
O2
47
SCHEMATIC OF O3 POLLUTION CHEMISRY
Production rate of O3 PO3k5nRO2nNO k7nHO2nNO
2k7nHO2nNO Prodn. of OH by 7 balanced
by loss of OH by 4 nOH (k7nHO2nNO/k4nRH) High
NOX ? HOx loss is rxn. 9 PHOx k9nOHnHO2nM PO3
(2k4PHOxnRH)/(k9nNO2nM) Linear dependence on
RH and inverse dependence on NOx
- O3 hv ? O2 O(1D)
- 2. O(1D) M ? O M
- 3. H2O O(1D) ? 2OH
- 4. RH OH ? RO2 H2O
- 5. RO2 NO ? RO NO2
- 6. RO O2 ? RCHO HO2
- 7. HO2 NO ? OH NO2
- 8. HO2 HO2 ? H2O2 O2
- 9. OH NO2 M ? HNO3 M
O2
48
NOx- AND HYDROCARBON-LIMITED REGIMES
NOx limited PO3 2k7(PHOx/2k8)1/2nNO
Hydrocarbon limited PO3 (2k4PHOxnRH)/(k9nNO2nM)
Complications Natural emissions of hydrocarbons
are important nNO and nNO2 are not linearly
related to NOx emissions Trnasport of pollutants
into and out of region
49
ISSUES IN O3 POLLUTION CONTROL
- Questions
- NOx or HC emission controls or combination
- Degree of emission controls
- Uncertainties
- Reliability of emission inventories (e.g. natural
hydrocarbon inventories) - Reliability of air quality models (e.g. local vs
transported NOx/HC/O3)
50
June 8 and 9, 1991 O3 Maps
O3 BUILD UP UNDER STAGNANT CONDITIONS
51
June 10 and 11, 1991 O3 Maps
REGIONAL O3 TRANSPORT
52
ATMOSPHERIC CHEMISTRY AND TRANSPORT MODELS
- Tools for understanding how the atmospheric
chemical system works - Why do we need them?
- Limited measurements (few stations, few species,
etc.) - Gain insights into factors controlling
concentrations - Evaluate current and future human impacts
- Design, plan and analyze field experiments
53
TYPES OF ATMOSPHERIC CHEMICAL TRANSPORT
MODELSBox Models
d/dt(Cit) ut(Cht-Cit)/l Horizontal flx
wt(Cvt-Cit)/h Vertical flx Qit/ht
Source - VditCit/ht Deposition Pit
Chem.Prodn - Lit
Chem Loss
54
TYPES OF ATMOSPHERIC CHEMICAL TRANSPORT
MODELSMoving Box Models
55
TYPES OF ATMOSPHERIC CHEMICAL TRANSPORT
MODELSColumn Models
56
TYPES OF ATMOSPHERIC CHEMICAL TRANSPORT MODELS2-
and 3-D Models
57
O3 DESIGN VALUES
- O3 design value under current NAAQS
- 4th highest 1-hour daily maximum concentration
over a - consecutive 3-year period
- O3 design value under proposed NAAQS
- 3-year (consecutive) average of annual 4th
highest - 8-hour daily max concentrations
58
O3 DESIGN VALUES MODEL VS OBSERVATIONS
observed
modeled
2nd highest daily 1-hr max
observed
modeled
4th highest daily 8-hr max
59
THE RELATIVE REDUCTION FACTOR (RRF) CONCEPT
- Determine design value at each monitor
- Determine effects of emission changes by
multiplying - design value by modeled relative reduction
- RRF mean daily max O3 with emission
reductions - mean daily max O3 from base case
simulation - reduction (1-RRF) x 100
60
MODEL CALCULATED RRF VALUES
50 NOx Emm.
80 NOx Emm.
2nd highest daily 1-hr max
50 NOx Emm.
80 NOx Emm.
4th highest daily 8-hr max
61
PREDICTED O3 DESIGN VALUES WITH NOX CONTROLS
modeled
observed
2nd highest daily 1-hr max
observed
modeled
4th highest daily 8-hr max
Recommended
CrystalGraphics Presentations


