
Designer Charts and Diagrams - PowerPoint PPT Presentation
Title:
Designer Charts and Diagrams
Description:
CrystalGraphics now offers a package of 89 beautifully designed charts and diagrams. For more info visit: – PowerPoint PPT presentation
Number of Views:10025
Title: Designer Charts and Diagrams
1
(No Transcript)
2
PowerPoint provides several basic charts and
diagrams
(and weve made them better)
3
PowerPoints default Pie of Pie diagram
4
Our improved Pie of Pie diagram
5
Now here are some charts with example data
6
A stacked cylinder chart shows the changes in a
data series over time or compares multiple items.
STACKED CYLINDER COLUMN DATA DRIVEN
7
An exploded doughnut chart is identical to a
doughnut chart except the slice being emphasized
is moved away from the center.
EXPLODED DOUGHNUT DATA DRIVEN
8
BUBBLE CHART IN 3D DATA DRIVEN
A bubble chart is a type of chart where each
plotted entity is defined in terms of three
distinct numeric parameters.
9
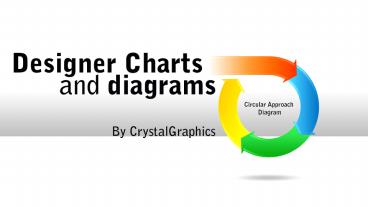
CIRCLE ARROWS
Circle arrow diagrams are commonly used to
represent order or process steps.
10
5 Ps OF SERVICES MARKETING
The 5 Ps of Services Marketing diagram is often
used as an introductory slide of a presentation
covering each element of a marketing campaign.
11
FILLED RADAR DATA DRIVEN
Radar charts are useful when you want to look at
several different factors, which are related to
one item.
12
FORCES AT WORK
The forces at work diagram provides a simple
perspective for analyzing the competitive
strength and position of a business organization.
13
LINE CHART DATA DRIVEN
A line chart displays information as a series of
data points connected by straight line segments.
14
PIE CHART DATA DRIVEN
15
FLOW CHART DIAGRAM
Recommended
CrystalGraphics Presentations


