
Best Home Loan in India - Citi Bank (1)
Title:
Best Home Loan in India - Citi Bank (1)
Description:
Citibank Offers home loans with low EMIs & attractive interest rates. Get loans online up to 10 Crore and leverage Home Credit to decide what interest you pay on your dream home. – PowerPoint PPT presentation
Number of Views:36
Title: Best Home Loan in India - Citi Bank (1)
1
PROPERTY
INSIGHTS
India Quarter 2, 2015
UPTICK IN ECONOMY, BETTER GROWTH PROSPECTS INDIA
MARKET OVERVIEW
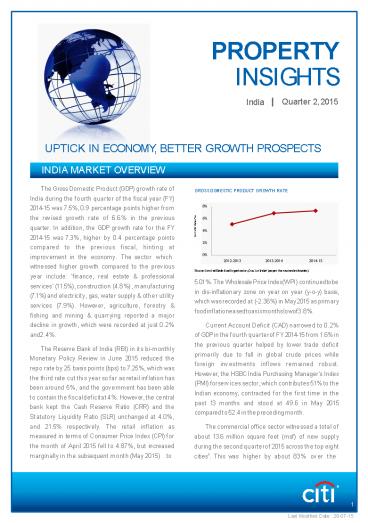
The Gross Domestic Product (GDP) growth rate of
India during the fourth quarter of the fiscal
year (FY) 2014-15 was 7.5, 0.9 percentage
points higher from the revised growth rate of
6.6 in the previous quarter. In addition, the
GDP growth rate for the FY 2014-15 was 7.3,
higher by 0.4 percentage points compared to the
previous fiscal, hinting at improvement in the
economy. The sector which
GROSS DOMESTIC PRODUCT GROWTH RATE
Growth Rate ()
witnessed higher growth compared to the previous
year include finance, real estate
professional services (11.5), construction
(4.8), manufacturing (7.1) and electricity,
gas, water supply other utility services
(7.9). However, agriculture, forestry fishing
and mining quarrying reported a major decline
in growth, which were recorded at just 0.2 and
2.4.
Source Central Statistical Organisation, Govt.
of India (as per the revised estimates)
5.01. The Wholesale Price Index(WPI)
continuedtobe in dis-inflationary zone on year
on year (y-o-y) basis, which was recorded at
(-2.36) in May 2015 as primary
foodinflationeasedtoasixmonthslowof3.8.
Current Account Deficit (CAD) narrowed to 0.2
of GDP in the fourth quarterof FY 2014-15 from
1.6 in the previous quarter helped by lower
trade deficit primarily due to fall in global
crude prices while foreign investments inflows
remained robust. However, the HSBC India
Purchasing Managers Index (PMI) forservices
sector, which contributes 51 to the Indian
economy, contracted for the first time in the
past 13 months and stood at 49.6 in May 2015
compared to 52.4 in the preceding month.
The Reserve Bank of India (RBI) in its bi-monthly
Monetary Policy Review in June 2015 reduced the
repo rate by 25 basis points (bps) to 7.25,
which was the third rate cut this year so far as
retail inflation has been around 5, and the
government has been able to contain the
fiscaldeficitat 4. However, the central bank
kept the Cash Reserve Ratio (CRR) and the
Statutory Liquidity Ratio (SLR) unchanged at
4.0, and 21.5 respectively. The retail
inflation as measured in terms of Consumer Price
Index (CPI) for the month of April 2015 fell to
4.87, but increased marginally in the
subsequent month (May 2015) to
The commercial office sector witnessed a total of
about 13.6 million square feet (msf) of new
supply during the second quarterof 2015 across
the top eight cities1. This was higher by
about 83 over the
1
2
preceding quarter as Chennai (17 times) and Pune
(5 times) saw a very substantial increase in the
supply. Similarly, total net absorption too
noted an increase by 25 from the previous
quarter to 9.9 msf, led by Bengaluru with 37
share in total net absorption followed by Pune
with 23 share. Overall vacancy level inched up
marginally by 0.13 percentage point over the
previous quarter and was recorded at 20.1 on
the back ofhuge supplyinflux.
(FC Road, Koregaon Park and Aundh) and Bengaluru
(Brigade Road) witnessed rentals declined by 2-5
owing to limited demand. Lower Parel and
Goregaon in Mumbai and Kamanahalli in Bengaluru
were the only main-streets where rentals
appreciated (q-o-q) by 13-15 and 7
respectively owing to limited availability
ofqualityspaceamidst increased enquiries.
In the residential sector, about 28,100 units
were launched in the top eight cities during the
second quarter of 2015, an increase of 14 over
the previous quarter. Within the total unit
launched this quarter, Delhi-NCR had the highest
share at 25, followed by Bengaluru with a 16
share. Capital values during the quarter
remained stable across most cities in comparison
to the previous quarter owing to slow pace of
sales velocity. However, few submarkets in
Kolkata and Pune witnessed appreciation in
capital values in 1-4 range for mid segment
units on the back of steady demand. Also,
high-end and luxury segments of a few submarkets
in Kolkata and Delhi- NCR respectively witnessed
about 3 appreciation in capital values on a
q-o-q basis. Residential sales are likely to
improve as banks have started reducing lending
rates on home loans.
In the retail sector, no new mall supply was
added during the second quarter of 2015. As a
result, overall mall vacancy levels of the top
eight cities declined by 1.1 percentage points to
13.6. In addition, three malls with high
vacancy levels, were closed this quarter in
Mumbai, contributing to a decline in overall
vacancy levels. Mall rentals remained stable
across most cities. However, certain submarkets
in western region of Mumbai (Kandivali, Kurla,
Thane, Bhandup-Mulund) and Pune (Hadapsar)
reported quarter-on-quarter (q-o-q) rental
decline of 7-9 decline owing to high
availabilities, low demand and competitive
pressure. Additionally, mall rentals in
Somajiguda and NTR Gardens in Hyderabad
witnessed double-digit decline (14-20) due to
decline in footfalls and lack of demand.
Rentals in certain main streets in Pune
Trends Updates
Economic Trends The Consumer Price Index (CPI)
increased marginally from (a three month low of)
4.87 recorded in April 2015 to 5.01 in May
2015. However, the CPI remained well within the
central bank's targetted comfort zone,
suppressing insecurities arising out of
forecasted rainfall deficit this year. Though
the Wholesale Price Index (WPI) remained in
dis-inflationary zone, it recorded narrower dis-
inflation in May 2015 at (-2.4) compared to
(-2.7) in the previous month. The inflation for
the minerals remained in sub-zero zone (-28.4)
for the tenth conseutive month, owing to about
36 fall in average price for the Indian crude
oil basket. Primary food inflation further eased
to a six month low of 3.8 in May 2015. The core
inflation (non-food manufactured products)
further fell to (-0.65) in May as against
(-0.41) in the previous month. 1Ahmedabad,
Bengaluru, Chennai, Delhi-NCR, Hyderabad,
Kolkata, Mumbai and Pune.
EXCHANGE RATE MOVEMENT (INR/USD)
INR/USD
Source RBI
FDI INFLOW IN HOUSING AND REAL ESTATE SECTOR
INR Crore
Source Dept. of Industrial Policy Promotion,
Govt, of India
2
3
In light of controlled CPI and WPI, the RBI
reduced repo rate by 25 bps to 7.25 in its
Bi-Monthly Monetary Policy Review held in June
2015. However, the centralbank has keptthe CRR
and SLR unchanged at 4.0 and 21.5
respectively. Further easing in key policy rates
are expected from the central bank owing to
positive macro-economic data such as controlled
twin deficit (current and fiscal deficits) and
inflation within comfort zone. The Indian
economy is projected to grow at 7.5 in the FY
2015-16.
BSE REALTY INDEX
Source BSE
previous year. Of this about 2.4 was attracted
by the construction development sector
(comprising townships, housing, built-up
infrastructure) totalling around INR 4,582
crores. On the back of robust foreign capital
inflows, the central bank added a whopping USD
61.4 billion to the foreign exchange reserves in
FY 2014-15, significantly higher from USD 15.5
billion in the previous fiscal.
The central governmenthas been able to achieve
better than targetted numbers on fiscal deficit
and revenue deficit front, which have been
confined to 4.0 and 2.8 for the FY 2014-15, as
against the targets of 4.1 and 2.9
respectively. The Current Account Deficit (CAD)
narrowed to 0.2 of GDP in the fourth quarter of
FY 2014-15 from 1.6 in the previous quarter.
CAD for the FY 2014-15 was also lower at 1.3 of
GDP compared to 1.7 in the previous fiscal,
primarily on account of lower crude oil prices
and robust foreign capital inflows.
The BSE Realty Index dropped by 251.25 points to
close at 1,413.26 points at the end of June 2015
due to capital outflows from FIIs especially in
the month of May amidst tax notices sent by the
Finance Ministry to the FIIs for the Minimum
Alternative Tax (MAT) payments forprevious years.
For the FY 2014-15, the FII investments in equity
and debt markets together stood at around INR
250,670 crores (USD 41 billion). However, the
Indian Rupee came under pressure as it fell
against the US dollar during the second quarter
of 2015 to INR 64.08 in June from INR 62.56 in
March as FIIs pulled out money from Indian
equities in the month of May amidst concerns
over Minimum Alternative Tax (MAT) notices and
subdued corporate earnings during the Jan-March
quarter.
The Cabinet Cabinet Committee on Economic
Affairs (CCEA) approved the low cost housing
scheme for promoting affordable housing for the
urban poor under the Housing for All by 2022
initiative in June 2015. Accordingly, the
interest subsidy has been hiked to 6.5 on
housing loans to beneficiaries belonging to
economically weakersections (EWS) including slum
dwellers and low-income groups (LIG).
The total Foreign Direct Investment (FDI) inflows
in India during FY 2014-15 were recorded at INR
189,107 crores (USD 31 billion), an increase of
28 over the
Residential Trends Capital values across most
cities remained stable on q-o-q basis owing to
slow pace of sales velocity amidst subdued
demand. However, select submarkets in
mid-segment in Kolkata witnessed about 2-4
q-o-q appreciation in capital values owing to
steady demand and improved infrastructure.
Additionally, luxury segment in Gurgaon
submarket in Delhi-NCR witnessed about 3
appreciation in capital values over the previous
RESIDENTIAL CAPITAL VALUES GROWTH INDEX
Source Cushman Wakefield Research
4
quarter, on the back of increased demand from
investors. In the near term, the capital values
are likely to remain stable until the demand
improves.
NEW RESIDENTIAL UNIT LAUNCHES ACROSS LOCATIONS IN
2Q 2015
During the second quarter of 2015, around 28,100
new unit launches were witnessed in the top
eight cities, higher by about 14 over the
preceding quarter. This was primarily due to
substantial increase in new launches in
Delhi-NCR, wherein new unit launches more than
doubled (144) over the previous quarter. In
addition, with about 6,900 unit launches,
Delhi-NCR accounted for 25 of the total unit
launches during Q2 2015, followed by Bengaluru
with a 16 share. Kolkata and Pune also witnessed
a q-o-q increase in unit launches by 15 and 13
respectively. New unit launches in Mumbai,
Chennai and Hyderabad declined from the previous
quarter and their respective shares in total
unit launches
Source Cushman Wakefield Research
during the quarter stood at 12, 8 and 4. Mid
segment accounted for nearly 63 in total unit
launches across top eight cities, followed by
affordable segment with a, 25 share. The
remainder of the unit launches were in high-end
(11) and luxury (1) segments.
5
Index
Ahmedabad. 6
Bengaluru.........................................
.............................................
9
Chandigarh........................................
............................................
13
Chennai. 16 Delhi - National Capital Region (NCR)
20 Hyderabad. 24 Jaipur 28 Kolkata. 31
Mumbai. 36 Pune 40
6
Ahmedabad
Market Overview
Nearly 2,300 units were launched during the
second quarter of 2015, marking an improvement of
33 from the previous quarter. Due to the launch
of two projects with more than 400 units each,
the Western submarket led the launch activity
with 54 contribution to total unit launches.
Mid segment dominated the quarterly unit
launches with a 56 share, whilst high-end
segment contributed the rest. Both capital and
rental values remained nearly stable across
submarkets during the quarter. Office sector
witnessed around 145,200 square feet (sf) of net
absorption in the second quarter of 2015,
registering a decline of 6 as compared to the
previous quarter. 96 of the quarterly net
absorption was contributed by Grade A
developments. Absence of new completions during
the second quarter amidst decent transaction
activity led to a 0.7 percentage points decline
in all Grades vacancy level to 18.5.
READY RESIDENTIAL PROPERTY VALUES IN JUNE '15
Source Cushman Wakefield Research
Represents Mid and High End segments
Ahmedabad mall vacancies declined by 0.1
percentage point over the quarter to 33.2 in the
second quarter of 2015. This marginal decline in
vacancy level was due to limited transaction
activity witnessed in malls amidst subdued
demand from retailers. The leasing activity in
main streets also declined due to limited
availability of quality spaces.
Trends Updates Ready Residential Property
Update
Capital values of ready residential projects
remained stable as compared to the previous
quarter. Select under-construction
residential projects by
reputed developers in key locations like
Satellite, Prahladnagar, S.G. Highway and
Vastrapur witnessed slightimprovementofup to 6
in quoted values.
7
Average Capital Values High-end Segment (INR '000/sf) Average Capital Values High-end Segment (INR '000/sf) Average Capital Values High-end Segment (INR '000/sf) Average Capital Values High-end Segment (INR '000/sf) Average Capital Values High-end Segment (INR '000/sf) Average Capital Values High-end Segment (INR '000/sf) Average Capital Values High-end Segment (INR '000/sf) Average Capital Values High-end Segment (INR '000/sf)
Location 2010 2011 2012 2013 2014 1Q 2015 2Q 2015
Satellite 4.0 - 4.8 4.3 - 6.0 4.3 - 6.0 4.3 - 6.0 4.3 - 6.0 4.3 - 6.0 4.3 - 6.5
Vastrapur 3.7 - 4.0 3.7 - 5.0 3.7 - 5.0 3.7 - 5.0 3.7 - 5.0 3.7 - 5.0 3.7 - 5.5
S.G.Highway 3.7 - 4.3 3.7 - 4.5 3.7 - 4.5 3.7 - 4.5 3.7 - 5.0 3.7 - 5.0 3.7 - 5.2
Prahlad Nagar 4.2 - 5.3 4.2 - 6.0 4.2 - 6.0 4.2 - 6.2 4.2 - 6.2 4.2 - 6.2 4.2 - 6.5
Source Cushman and Wakefield Research Note The
above values for high-end segment typically
include units of 2,000-4,000 sf
Average Capital Values Mid Segment (INR 000/sf) Average Capital Values Mid Segment (INR 000/sf) Average Capital Values Mid Segment (INR 000/sf) Average Capital Values Mid Segment (INR 000/sf) Average Capital Values Mid Segment (INR 000/sf) Average Capital Values Mid Segment (INR 000/sf) Average Capital Values Mid Segment (INR 000/sf) Average Capital Values Mid Segment (INR 000/sf)
Location 2010 2011 2012 2013 2014 1Q 2015 2Q 2015
Satellite 2.8 - 3.8 2.8 - 4.3 2.8 - 4.3 2.8 - 4.3 2.8 - 4.3 2.8 - 4.3 3.0 - 4.3
Vastrapur 2.6 - 3.5 2.6 - 3.8 2.6 - 3.8 2.6 - 3.9 2.6 - 3.9 2.6 - 3.9 2.8 - 4.0
S.G.Highway 3.0 - 3.8 3.3 - 4.3 3.3 - 4.3 3.0 - 4.3 3.0 - 4.3 3.0 - 4.3 3.2 - 4.3
Prahlad Nagar 2.8 - 3.6 3.2 - 4.2 3.2 - 4.2 3.2 - 4.3 3.2 - 4.3 3.2 - 4.3 3.5 - 4.3
Source Cushman and Wakefield Research Note The
above values for mid segment typically include
units of 1,200-1,800 sf Limited availability at
quoted values
New Residential Launches Nearly 32 of the total
2,300 launches in second quarter of 2015 were 2
Bedroom-Hall-Kitchen (BHK) configuration, while
30 were 3 BHK configuration. The 2 and 3 BHK
units launched this quarter had an average size
of 1,550 and 2,400 sf respectively. Due to the
continued preference of locations in the
Western submarket amongst end-users, all the
high- end segment launches this quarter were
located in this submarket. Nearly 80 of the
launches were witnessed in locations like
Thaltej, Vejalpur and Nehrunagar in the high-end
segment.
Project Name Developer Location Number of Units Type Area of Units (sf)
Maple Tree Ganesh Housing Thaltej 512 Apartments 3 BHK 2,295 4 BHK 4,412
Cloud 9 JV - Addor Realty Vivan Infrastructure Nehrunagar 448 Apartments 2 BHK 2,295 3 BHK 2,943 4 BHK 2,943 to 3,573
Swami Narayan Park 2 Dharmadev Vasna 400 Apartments 2 BHK 1,125 to 1,215
Unique Ashiyana Unique Infraspace Gota 384 Apartments 1 BHK 774 to 801 2 BHK 1,179
Orchid Heights HN Safal Sardar Patel Ring Road 272 Apartments 3 BHK 1,960 4 BHK 2,460
Sun Simpolo Sun Builders Bodakdev 246 Apartments 1 BHK 585 1.5 BHK 720
Parijat B Safal Constructions Vejalpur 44 Apartments 4 BHK 3,857
Estimated and as per market information
8
Under Construction Residential Property Update
The western submarkets continued to dominate the
under-construction scenario with locations such
as Prahladnagar, Vasna, Bopal, etc. leading the
activity. Northern locations like Motera and
Ranip also witnessed sizeable construction
activity due to
availability of large tracts of land and
comparatively affordable rates at these
locations. Capital values in under-construction
projects remained mostly stable to stay relevant
in competitive market.
Commercial Office Sector
Ahmedabad witnessed 153,200 sf of leasing
activity in the second quarter of 2015. The
IT-ITeS sector dominated the leasing activity
followed by consulting sector with 69 and 18
contribution respectively. Gandhinagar (65) and
S.G. Highway (25) witnessed maximum leasing
during this period accounting for 90 of the
total activity. This
quarter witnessed the first pre-commitment of the
year, with a telecom company committing to
30,000 sf of space in an upcoming Grade A
development. Grade A vacancy also dipped by 1.6
percentage points to 31.8 due to no new supply
and sizeable transaction activity during the
quarter.
Retail Sector Mall rentals continued to remain
stable due to limited enquiries and high vacancy
levels. Majority of the enquiries across malls
and main streets were from Food Beverage (FB)
retailers and lifestyle brands.
Main street rentals also remained stable amidst
limited transaction activity as landlords quoted
similarrents to attractretailers.
Outlook Residential launches are likely to
decline marginally in the coming quarter amidst
sizeable unsold inventory, limited projects in
pre-launch phase and wait-and-watch approach
being adopted by buyers. Some developers may
postpone their project launches to the fourth
quarter expecting improvement in sales during
the festive season.
contribute to an increase in vacancy levels
across submarkets.
Retail leasing activity is likely to be moderate
due to no new mall supply and limited
availability of quality space in existing malls.
Mall rentals are likely to remain stable except
S.G. Highway which might register slight
correction due to high vacancy levels. Main
streets are expected to witness improvement in
demand with major enquiries from FB and
jewellery retailers. Key main street locations
like C.G. Road, Prahladnagar and S.G. Highway
might record marginal improvement in rentals
with pick-up in demand.
Nearly 1.97 msf of Grade A new office supply is
likely to be delivered by the end of the year in
Ahmedabad. While transaction activity is expected
to improve, it is unlikely to keep pace with the
expected increase in supply during the coming
quarters. This demand-supply imbalance might
9
Bengaluru
Market Overview
In the second quarter of 2015, nearly 4,500 units
were launched a 10 increase from the previous
quarter. Mid segment unit launches were dominant,
with a total share of about 90. The Eastern and
Northern submarkets comprised of maximum unit
launches of 28 and 27 respectively. The office
supply doubled from the previous quarter and was
recorded at nearly 4.0 million square feet
(msf). More than half (57) of the Grade A
supply was witnessed in Outer Ring Road, followed
by 26 in the Peripheral South Market. Strong
leasing in Grade A spaces was noted at 3.8 msf,
which was similar to the leasing recorded in the
previous quarter. A combination of steady leasing
activities and no new mall supply led to a
dip in the overall mall
READY RESIDENTIAL PROPERTY VALUES IN JUNE'15
Source Cushman Wakefield Research
Represents Mid and High End segments
vacancy by 0.3 percentage point to 8.46 in
Bengaluru. In the second quarter of 2015, the
rentals across all malls and main streets
remained largely steady, with a few exceptions.
Trends Updates
Ready Residential Property Update Capital Values
across all submarkets in Bengaluru maintained
status quo, especially due to slow-moving
inventory. The rental values in mid segment of
South- Eastern and Eastern submarkets comprising
of the IT hub along Outer Ring Road (ORR) and
Whitefield locations witnessed a
quarter-on-quarter rental appreciation of 5.
The proximity to these IT
destinations and the presence of quality social
and physical infrastructure act as a strong
demand driver leading to a subsequent increase
in demand for rental housing in the
South-Eastern and Eastern submarkets. However,
the high-end segment of the Eastern submarket
witnessed softening of demand, resulting in a 5
dipinrentalsfromthepreviousquarter.
10
Average Capital Values High-end Segment (INR000/sf) Average Capital Values High-end Segment (INR000/sf) Average Capital Values High-end Segment (INR000/sf) Average Capital Values High-end Segment (INR000/sf) Average Capital Values High-end Segment (INR000/sf) Average Capital Values High-end Segment (INR000/sf) Average Capital Values High-end Segment (INR000/sf) Average Capital Values High-end Segment (INR000/sf) Average Capital Values High-end Segment (INR000/sf) Average Capital Values High-end Segment (INR000/sf)
Location 2008 2009 2010 2011 2012 2013 2014 1Q 2015 2Q 2015
Central 14.0 - 18.0 12.0 - 14.5 13.5 - 17.5 14.0 - 18.0 18.0 - 28.0 18.0 - 30.0 18.0 - 30.0 18.0 - 30.0 18.0 - 30.0
South 7.0 - 9.0 6.0 - 8.5 6.0 - 9.5 6.5 - 10.0 6.5 - 10.0 6.8 - 10.3 7.0 - 10.3 7.0 - 10.5 7.0 - 10.5
Off-Central 6.5 - 7.5 5.0 - 6.8 5.0 - 7.0 6.0 - 8.5 7.0 - 9.0 8.0 - 11.0 8.0 - 11.0 8.0 - 11.0 8.0 - 11.0
East 6.5 - 9.0 5.6 - 7.0 6.5 - 7.5 6.8 - 8.0 6.5 - 9.0 6.5 - 10.0 6.5 - 10.0 6.5 - 10.0 6.5 - 10.0
North 6.0 - 8.0 5.5 - 7.0 5.5 - 7.0 6.5 - 8.0 6.5 - 8.2 7.0 - 9.5 7.0 - 9.8 7.0 - 11.0 7.0 - 11.0
Source Cushman and Wakefield Research Note The
above values for high-end segment typically
include units of 2,000-4,000 sf.
Average Capital Values Mid Segment (INR000/sf) Average Capital Values Mid Segment (INR000/sf) Average Capital Values Mid Segment (INR000/sf) Average Capital Values Mid Segment (INR000/sf) Average Capital Values Mid Segment (INR000/sf) Average Capital Values Mid Segment (INR000/sf) Average Capital Values Mid Segment (INR000/sf) Average Capital Values Mid Segment (INR000/sf) Average Capital Values Mid Segment (INR000/sf) Average Capital Values Mid Segment (INR000/sf)
Location 2008 2009 2010 2011 2012 2013 2014 1Q 2015 2Q 2015
Central 5.8 - 7.0 5.0 - 6.0 5.5 - 7.0 6.0 - 7.5 6.0 - 8.0 9.0 - 12.0 9.0 - 12.0 9.5 - 13.0 9.5 - 13.0
East 2.7 - 3.1 2.4 - 2.7 2.7 - 3.1 3.2 - 3.8 3.8 - 4.8 4.0 - 5.5 4.0 - 5.5 4.3 - 5.7 4.3 - 5.7
South-East 2.9 - 4.0 2.5 - 3.2 2.8 - 4.0 3.4 - 5.0 4.0 - 5.5 4.5 - 5.9 4.5 - 6.0 4.5 - 6.3 4.5 - 6.3
North 5.0 - 6.5 2.8 - 4.0 2.8 - 4.4 3.0 - 4.8 6.0 - 9.0 6.0 - 9.0 6.0 - 9.0 7.0 - 10.0 7.0 - 10.0
South 3.0 - 4.0 4.6 - 5.7 4.8 - 6.0 5.0 - 6.5 3.5 - 5.5 3.5 - 5.5 4.0 - 5.5 4.0 - 6.5 4.0 - 6.5
South-West 2.8 - 4.2 2.7 - 3.9 3.2 - 4.5 3.6 - 5.0 4.0 - 5.5 4.5 - 6.5 4.5 - 6.5 4.5 - 6.5 4.5 - 6.5
Off-Central 3.5 - 6.0 3.3 - 5.7 4.0 - 6.2 4.5 - 6.7 5.0 - 7.5 7.0 - 10.0 7.0 - 10.0 7.0 - 10.0 7.0 - 10.0
Off-Central 4.0 - 6.0 3.7 - 5.7 3.8 - 6.2 4.3 - 6.7 5.0 - 7.0 6.0 - 8.0 6.5 - 8.5 6.5 - 8.5 6.5 - 8.5
North-West 4.2 - 5.8 3.5 - 5.2 3.8 - 5.6 4.3 - 6.2 4.5 - 6.5 5.5 - 6.5 6.0 - 6.8 6.0 - 6.8 6.0 - 6.8
Source Cushman and Wakefield Research Note The
above values for mid segment typically include
units of 1,600-2,000 sf.
Key to locations
High-end segment
East Marathalli, Whitefield, Old Airport Road
Central Lavelle Road, Off Palace Road, Off
Cunnigham Road, Ulsoor Road, Richmond Road
South-East Sarjapur Road, Outer Ring Road, HSR
Layout
South Koramangala, Outer Ring Road, Bannerghatta
Road, JP Nagar
South Kormangala, Jakkasandra
South-West Jayanagar, J P Nagar, Kanakpura Road,
Bannerghatta Road, BTM Layout
Off-Central Frazer Town, Benson Town, Richards
Town, Dollars Colony
North Hebbal, Bellary Road, Yelahanka,
Dodballapur Road, Jalahalli
East Whitefield (villas)
Off-Central Vasanth Nagar, Richmond Town and
Indiranagar
North Hebbal, Yelahanka, Jakkur, Devanahalli
Off-Central Cox Town, Frazer Town, HRBR,
Benson Town, etc.
Mid segment
Central Brunton Road, Artillery Road, Ali Askar
Road, Cunningham Road
North-West Malleshwaram, Rajajinagar
10
11
New Residential Launches The second quarter of
2015 witnessed new unit launches of
approximately 4,500 units. Similar to the last
quarter, 69 of these total launches were
pre-launched in the previous quarters. Overall,
there was a 10 quarter-on-quarter increase in
the total units launched, with over 90 share
belonging to
the mid segment projects. The Eastern submarket
witnessed 28 of unit launches especially in the
Old Madras Road and Whitefield locations. This
was followed by 27 share of the total launches
in Northern sub-market, especially in Horamavu
and Off Hennur Road locations.
Project Name Developer Location Number of Units Type Area of Units (in sf)
Vaishnavi Gardenia Vaishnavi Group Jalahalli 600 Apartments 2 BHK 1,100 to 1,175 3 BHK 1,440 to 1,550
Bollineni Silas Bollineni Whitefield 499 Apartments 2 BHK 1,060 to 1,405 3 BHK 1,590 to 1,600
Salarpuria Sattva Cadenza Salarpuria Sattva Group Hosur Road 493 Apartments 1 BHK 703 2BHK 1,183 2.5 BHK 1,564 3 BHK 1,850
Purva Waves Puravankara Developers Hennu Road 468 Apartments 2 BHK 1,232 to 1,348 3 BHK 1,630 to 1,846
Vaswani Equisite Vaswani Group Whitefield 450 Apartments 2 BHK 1,890 to 2,330 3 BHK 2,820
Gopalan Olympia -Phase I Gopalan Enterprises Kumbalgodu 449 Apartments 2 BHK 1,000 3 BHK 1,360
Prestige Gulmohar Prestige Group Horamavu 400 Apartments 2 BHK 1,169 2.5 BHK 1,370 3 BHK 1,623 to 1,752
DSR Waterscape DSR Properties Horamavu Road 334 Apartments 2 BHK 1,179 to 1,255 3 BHK 1,435 to 1,752
Vaswani Claremont Vaswani Group Whitefield 300 Apartments 2 BHK 1,150 to 1,200 3 BHK 1,590 to 2,100
Emmanuel Heights Emmanuel Constructions Sarjapur Road 293 Apartments 2 BHK 1,115 to 1,197 3 BHK 1,445 to 3,366
TG Epitome TG Developers Doddanekundi 93 Apartments 2 BHK 1,200 3 BHK 1,400
Garuda Green Field Garudachala Estates Mahadevapura, Outer Ring Road 90 Apartments 2 BHK 1,200 3 BHK 1,450
The Big Tree Ceear Realty Jayanagar 9 Apartments 4 BHK 4,300
Estimated and as per market information Under
Construction Residential Property Update
Around 174,600 residential units are under
construction across various submarkets. Mid
segment comprises at least 56 of the total
under- construction units, followed by 23 of
units in the affordable segment. Most of the new
under construction units noted in this quarter
were mid segment apartments offering 2BHK and
3BHK configuration. Affordable segment launches
appeared to be subdued in this quarter as
compared to 6 of the total unit launches
launched in the last
quarter. Far South, North and Eastern locations
comprise of a predominant (75) share of the
total affordable projects under construction in
the city.
Over the last few quarters, developers have
offered schemes like paying pre-EMI or giving a
buy- back option to the end user post procession
to incentivize the latter and increase the
sales. Given the slow movement of existing
inventory, different subvention schemes are on
the rise across the city.
12
Commercial Office Sector Grade A net absorption
of about 3.2 msf was recorded during the second
quarter of 2015. While the transactions in Grade
A spaces were healthy this quarter, relocation
activities resulted in a comparatively lower net
absorption of 3 from the previous quarter.
However, Grade A leasing was at 3.8 msf and at
par with the previous quarter. Major leasing
activities were noted in the Outer Ring Road
(41) and Peripheral East (22) submarkets. Also,
the IT-ITeS continued to be a dominant demand
driver with nearly 76 of the total leasing,
followed by BFSI sector that constituted 8 of
total leasing. The second quarter of 2015,
recorded total pre-
commitments of 1.2 msf, nearly 41 increase from
the previous quarter.
Bengaluru witnessed a rental decline in select
submarkets in Grade A office spaces. Peripheral
South and Suburban East witnessed a 6 and 13
decline in their weighted average rentals
respectively, owing to limited absorption and
available spaces quoting lower rentals. Given
high new supply and healthy absorption, the
overall Grade A vacancy increased by 0.5
percentage point and stood at 8.5.
Retail Sector Mall and main street rentals were
stable across most submarkets during the second
quarter of 2015. While there was no new mall
supply, steady leasing activities were noted in
malls across Whitefield, Magrath Road and
Malleswaram, especially by apparel, electronic
and Food Beverage (FB) retailers. Among main
streets, Kamanahalli Main Road rentals
appreciated by 7.7 owing to increased
enquiries and limited availability of quality
space. On the other hand, Brigade Road witnessed
a 5 rental decline, owing to dwindling demand
over the last few quarters. Automobile, fitness,
apparel and jewellery brands were some of the
prominent retailers that leased space in
Koramangala, Indiranagar and Commercial Street
in this quarter.
Outlook The residentiallaunches are likely tobe
restrained in the followingquarters due
tosurplus existing inventory, amidst stable
demand across most submarkets. Rental and
capital values are likely to remain stable across
most submarkets, with the exception of the
South- Eastern and Eastern submarkets which may
witness a capital value appreciation in the mid
segment due to growingdemand.
be in Grade A development. Outer Ring Road and
Peripheral East submarkets are likely to witness
marginal rental appreciation due to continued
demand, while the other submarkets may maintain
status quo in their rental values.
Rentalsmayholdsteadyacrossmostmallsandmain
streets. Anewmallmeasuring 320,000 sfis
expectedto be operational in Binnypet next
quarter. New BEL Road and Kamanahalli Main Road
are likely to witness an upwardrentalrevisionduet
osteadydemand.
In the third quarter of 2015, new office supply
of nearly 3.5 msf is expected, most of which is
likely to
13
Chandigarh
Market Overview
In the second quarter of 2015, approximately
1,100 units were launched in the Tri-City region.
The new launches were primarily in the outskirts
in submarkets of Zirakpur and Mohali. The
high-end segment witnessed healthy transaction
activity during the quarter. However, capital
values continued to maintain status quo due to
sustained selling pressure. Capital values in
the mid segment too remained stable across
submarkets. Submarkets in Peer Mushalla,
Zirakpur and Mohali witnessed increased number
of inquiries as construction work on the ring
road recommenced during the quarter. No new
office space was added to the Tri-City during
the quarter. Demand for office space during the
quarter was primarily from companies belonging
to Banking, Financial and Insurance Services
(BFSI), consulting and telecommunication
sectors. Grade A office rentals remained stable
during the quarter, due to the high prevailing
vacancies and subdued demand. Approximately
350,000 sf of retail area was added to the
Tri-City region in the second quarter of 2015.
READY RESIDENTIAL PROPERTY VALUES IN JUNE'15
Source Cushman Wakefield Research
Represents Mid and High End segments
Vacancy levels in the submarket of Mohali
increased due to the addition of new supply.
Demand for mall space remained tepid during the
quarter. In the main street locations, demand
was primarily from footwear and apparel brands.
Rentals remained stable for both malls and main
street locations across Chandigarh.
Trends Updates Ready Residential Property
Update Capital values remained stable across all
locations from the previous quarter. Transaction
activity in the high-end segment improved during
the quarter with availability of good deals
at
competitive prices. Despite improved buyers
interest, capital values in the markets of
Zirakpur and Mohali remained stable due to
high-unsold inventory in the market.
14
Average Capital Values High-end Segment (INR) Average Capital Values High-end Segment (INR) Average Capital Values High-end Segment (INR) Average Capital Values High-end Segment (INR) Average Capital Values High-end Segment (INR) Average Capital Values High-end Segment (INR) Average Capital Values High-end Segment (INR)
Location 1Q 2014 2Q 2014 3Q 2014 4Q 2014 1Q 2015 2Q 2015
Chandigarh Sector 2-11 155,000 - 170,000/sqyd 155,000 - 170,000/sqyd 155,000 - 170,000/sqyd 155,000 - 170,000/sqyd 155,000 - 170,000/sqyd 155,000 - 170,000/sqyd
Chandigarh Sector 28 140,000 - 160,000/sqyd 140,000 - 160,000/sqyd 140,000 - 160,000/sqyd 140,000 - 160,000/sqyd 140,000 - 160,000/sqyd 140,000 - 160,000/sqyd
Panchkula 110,000 - 145,000/sqyd 110,000 - 145,000/sqyd 110,000 - 145,000/sqyd 110,000 - 145,000/sqyd 110,000 - 145,000/sqyd 110,000 - 145,000/sqyd
Manimajra 14,000/sf 14,000/sf 14,000/sf 14,000/sf 14,000/sf 14,000/sf
Source Cushman and Wakefield Research Note The
above values for high-end segment typically
include units of 2,000-4,000 sf, both apartments
and villa sqyd Square Yard
Average Capital Values Mid Segment (INR/sf ) Average Capital Values Mid Segment (INR/sf ) Average Capital Values Mid Segment (INR/sf ) Average Capital Values Mid Segment (INR/sf ) Average Capital Values Mid Segment (INR/sf ) Average Capital Values Mid Segment (INR/sf ) Average Capital Values Mid Segment (INR/sf )
Location 1Q 2014 2Q 2014 3Q 2014 4Q 2014 1Q 2015 2Q 2015
Zirakpur 2,800 - 3,400 2,800 - 3,400 2,800 - 3,500 2,800 - 3,600 2,800 - 3,600 2,800 - 3,600
Mohali 3,000 - 3,800 3,200 - 3,800 3,200 - 4,000 3,200 - 4,200 3,200 - 4,200 3,200 - 4,200
Dera Bassi 2,800 - 3,200 2,800 - 3,400 2,800 - 3,500 2,700 - 3,500 2,700 - 3,500 2,700 - 3,500
Panchkula 2,800 - 3,400 2,800 - 3,400 2,900 - 3,500 2,900 - 3,500 2,900 - 3,500 2,900 - 3,500
Source Cushman and Wakefield Research Note The
above values for mid segment apartments typically
include units of 1,600-2,000 sf
Key to Locations High-end Segment Panchkula
Sectors - 2, 4, 6, 7, 8, 9, 15
Mid Segment Mohali Sectors - 114, 115,
127 Panchkula Sector - 20
New Residential Launches The Tri-City region
witnessed launch of approximately 1,100 units in
the second quarterof 2015. With basic prices in
the range of INR 3,200-3,800/sf,
new launches were primarily in the western and
southern regions namely, Zirakpurand Mohali.
Project Name Developer Location Number of Units Type Area of Units (sf)
Gillco Park Hills Gillco Sector 126, Mohali 700 Apartments 2 BHK 1,075 3 BHK 1,420 to 1,655 4 BHK 2,350
The Eminence Alliance Buildtech Zirakpur 192 Apartments 3 BHK 1,460
Tulip and Carnation Tower Ansal API Sector 115, Mohali 192 Apartments 3 BHK 1,695 to 1,806
15
Under Construction Residential Property Update
In Q2 2015, capital values of under construction
remained stable across submarkets. The
submarkets of Peer Mushalla, Zirakpur and Mohali
witnessed increased traction as the new airport
is
expected to begin operation shortly. Few projects
in Zirakpur and Panchkula are expected to be
ready for possession in the next quarter.
Commercial Office Sector In the second quarter of
2015, BFSI, consulting and telecommunication
sector companies had a major share in office
space take-up. Quoted rentals of IT Parks
and SEZs were around INR 50-60 per square feet
per month (psf pm) and commercial spaces were at
INR 70- 95 psfpm.
Retail Sector The second quarter of 2015
witnessed approximately 350,000 sf of new retail
space. Demand in mall space was primarily from
Food and Beverage (FB), jewellery and home
furnishing brands. Some of the retailers
include, Coffee Day,
Carat lane and Nilkamal. In main street
locations, footwear and apparel, retailers such
as Hush Puppies and Blackberry took up space in
Sector 17 market. Rentals across malls and main
street locations remained stable during the
second quarterof 2015.
Outlook Capital values are likely to remain
stable in the high-end segment despite
improvement in transaction activity, especially
due to significant existing unsold inventory.
New launch activity is likely to pick up in the
southern submarket of Zirakpur and on the 200ft
road as the new airport begins operation.
rentals are expected to remain stable over the
next quarter, considering the prevailing high
vacancies.
No new mall space is scheduled for completion in
the third quarter of 2015, which is expected to
lead to decline in vacancy levels. Rental values
in malls are expected to remain stable in
Chandigarh city due to stable demand whilst they
may soften marginally in the peripheral
submarkets, during the next quarter due to high
vacancies and tepid demand.
No new office supply is likely to be added in the
next quarter. Demand may remain moderate and
16
Chennai
Market Overview
During the second quarter of 2015, new
residential unit launches declined sharply by 33
over the previous quarter to nearly 2,100 units.
However, mid segment constituted the highest
proportion of launches during this quarter and
comprised nearly 92 of total units launched.
Southern and South-west quadrants of the city,
primarily Grand Southern Trunk (GST) Road and
Suburban (South) together comprised 59 of total
new launches as upcoming IT-ITeS office
developments and proximity to suburban business
hubs rendered these locations attractive for home
buyers. Launches in high-end segment rose by 26
over the previous quarter, mainly due to
increasing number of new unit offerings in this
segment in Nungambakkam. On an overall basis,
high-end segment comprised 8 of new unit
launches. Chennai witnessed sizeable new office
supply of nearly 1.3 msf during the second
quarter of 2015, comprising of IT parks (74)
and commercial office spaces (24). However, in
line with the first quarter of 2015, no new
supply of IT-Special Economic Zone (IT-SEZ)
became operational. The share of Grade A
developments as a proportion of total supply
increased from 27 in the first quarter to 74 at
the end of this quarter. This is primarily
because a new block of a prominent IT Park
became operational in Perungudi. Occupier
demand, mainly from the IT- ITeS sector,
remained strong leading to a 7
READY RESIDENTIAL PROPERTY VALUES IN JUNE'15
Represents Mid and High End segments
Source Cushman Wakefield Research
quarterly uptick in net absorption for Grade A
spaces which was noted at 529,700 sf. However,
dearth of new developments, mainly IT-SEZs slowed
down the expansion plans of few occupiers and
overall net absorption levels dipped by 11 over
the previous quarter. Mall stock in Chennai
remained static as supply infusion remained
absent for the sixth consecutive quarter.
Limited leasing coupled with the exit of a few
big retailers, including anchor tenants from
some malls in Chennai-CBD led to a 2.3 percentage
point rise in mall vacancy to 7.9 on a q-o-q
basis. Owing to limited churn and modest demand,
mall rentals remained maintained status-quo
across submarkets.
Trends Updates
Ready Residential Property Update Nearly 1,600
new residential units spread across 22 projects
completed construction during this period, a
stark decline of 37 over the previous quarter.
Many developers delayed possession of under
construction projects to second half of the year
due to several factors such as slow pace of
construction and high costs of building
materials.
GST Road (26) and Rajiv Gandhi Salai-II (16)
accounted for the highest number of unit
completions with builders such as Khivraj
Olympia, South India Shelters Pvt. Ltd and
Vishram Builders being prominent amongst others
who handed over completed units to buyers.
Rental and capital values largely remained
stable for all submarkets.
17
Average Capital Values High-end Segment (INR 000/sf) Average Capital Values High-end Segment (INR 000/sf) Average Capital Values High-end Segment (INR 000/sf) Average Capital Values High-end Segment (INR 000/sf) Average Capital Values High-end Segment (INR 000/sf) Average Capital Values High-end Segment (INR 000/sf) Average Capital Values High-end Segment (INR 000/sf) Average Capital Values High-end Segment (INR 000/sf) Average Capital Values High-end Segment (INR 000/sf)
Location 2009 2010 2011 2012 2013 2014 1Q 2015 2Q 2015
Boat Club 18.0-20.0 18.0-23.0 20.0-25.0 23.0-27.0 23.0-33.0 23.0-35.0 23.0-35.0 23.0-35.0
R.A Puram 13.0-15.0 13.0-16.5 14.0-17.0 15.0-19.0 17.0-23.0 17.0-23.0 17.0-25.0 17.0-25.0
Besant Nagar NA NA 12.5-13.5 13.0-14.5 13.5-15.0 13.5-15.0 13.5-15.0 13.5-15.0
Kotturpuram NA NA 12.0-14.0 14.0-16.0 14.0-20.0 14.0-20.0 14.0-20.0 14.0-20.0
Adyar 5.5-9.5 8.0-12.0 11.5 - 13.5 13.0-14.5 14.0-17.5 14.0-17.5 16.0-17.5 16.0-17.5
Poes Garden 14.5-18.0 14.5-20.0 17.5-24.5 18.5-25.0 20.5-28.0 20.5-33.0 23.0-33.0 23.0-33.0
Nungambakkam 13.0-16.0 13.0-16.5 13.0-17.0 17.0-20.0 14.0-25.0 14.0-25.0 14.0-25.0 14.0-25.0
Anna Nagar 6.0-9.0 7.5-10.5 8.0-11.5 12.0-14.0 12.0-17.0 12.0-17.0 12.0-17.0 12.0-17.0
Kilpauk 4.0-8.0 8.0-12.0 9.0-15.0 12.0-15.0 12.0-16.0 12.0-16.0 12.0-16.0 12.0-16.0
Source Cushman Wakefield Research Note The
above values for high-end segment typically
include units of 1,800-4,000 sf The time series
have been adjusted to reflect the updated
values RA Puram also includes Alwarpet and
Abhiramapuram Poes Garden also includes Venus
Colony and Kasturi Rangan Road
Average Capital Values Mid Segment (INR 000/sf) Average Capital Values Mid Segment (INR 000/sf) Average Capital Values Mid Segment (INR 000/sf) Average Capital Values Mid Segment (INR 000/sf) Average Capital Values Mid Segment (INR 000/sf) Average Capital Values Mid Segment (INR 000/sf) Average Capital Values Mid Segment (INR 000/sf) Average Capital Values Mid Segment (INR 000/sf) Average Capital Values Mid Segment (INR 000/sf)
Location 2009 2010 2011 2012 2013 2014 1Q 2015 2Q 2015
Adyar 4.5 - 6.5 6.0 - 8.5 8.0 - 11.0 9.0 - 13.0 10.0 - 14.0 10.0 - 14.0 12.0 - 15.0 12.0 - 15.0
RajivGandhi Salai(Perungudi) 2.5 - 2.8 3.5 - 4.5 4.0 - 5.5 5.0 - 6.3 5.0 - 6.3 5.0 - 6.3 5.0 - 7.0 5.0 - 7.0
Velachery 3.5 - 4.0 3.5 - 5.0 3.5 - 5.5 4.5 - 6.5 6.0 - 8.0 6.0 - 8.0 6.0 - 8.0 6.0 - 8.0
T. Nagar 4.0 - 6.5 7.5 - 10.5 8.5 - 11.5 8.5 - 14.0 10.0 - 16.0 10.0 - 17.0 10.0 - 17.0 10.0 - 17.0
Mylapore NA NA 8.0 - 12.5 10.0 - 15.0 12.0 - 17.0 12.0 - 17.0 12.0 - 17.0 12.0 - 17.0
Mogappair NA NA 5.0 - 5.5 5.0 - 6.5 5.0 - 7.5 5.0 - 7.5 5.0 - 7.5 5.0 - 7.5
Kilpauk 4.5 - 6.0 6.0 - 8.0 7.5 - 9.5 9.0 - 12.0 9.0 - 12.0 No availability No availability No availability
Source Cushman Wakefield Research Note The
above values for mid segment typically include
units of 1,000-2,000 sf The time series have
been adjusted to reflect the updated values
New Residential Launches New launches plummeted
from 3,200 units over the previous quarter to
nearly 2,100 units by the end of June 2015.
Whilst mid-segment continued to dominate the
maximum share of new unit launches, it also
acted as a catalyst behind the sizeable dip in
overall launches as mid-segment units declined
quarterly by 36. On an overall basis, 20 new
projects were launched out of which apartments
constituted 89 of total new units, remaining
constituting villa projects.
18
Project Name Developer Location Number of Units Type Area of Units (in sf)
Emerald Hallmark Infrastructure Chettipunniyam 860 Apartments 1 BHK 710 2 BHK 942 to 1,100
Bollineni Hillside Phase II BSCPL Infrastructure Ltd. Perumbakkam 383 Apartments 1 BHK 920 to 1,035 2 BHK 1,060 to 1,330 2.5 BHK 1,380 to 1,515 3 BHK 1,520 to 1,580
Optima Upgrade Optima Homes Pvt. Ltd. Avadi 180 Apartments 1.5 BHK 595 2 BHK 765 to 1,010 2.5 BHK 1,040 3 BHK 1,140 to 1,470
Creations Genesis Creations Promoters Navalur 156 Apartments 1 BHK 594 to 680 2 BHK 750 to 1,100 3 BHK 1,150 to 1,500
Frontier ETA Star Neikuppi 84 Villas 4 BHK 5,000
Adria Royal Splendour Developers Kovur 76 Apartments 1 BHK 497 to 595 2 BHK 750 to 1,167 3 BHK 1,297 to 1,485
R.S. Orchid R S Promoters Developers Manimangalam 73 Villas 2 BHK 1,450 to 1,578 3 BHK 1,722 to 1,795
VGN Presidency VGN Developers Nungambakkam High Road 72 Apartments 3 BHK 3,278 to 3,467
Akshaya Level Up Akshaya Homes Sterling Road 50 Apartments 3 BHK 2,037 to 3,387
ETA Lilac Heights ETA Star Greenways Road 48 Apartments 3 BHK 2,498 to 4,273
Nest Njoy Nest Builders Promoters East Coast Road 45 Villas 1 BHK 530 2 BHK 970 3 BHK 1,545
Poomalai Varishtaa Poomalai Housing Medavakkam 37 Villas 3 BHK 1,505 to 1,984 4 BHK 2,075 to 2,420
Violet ECO Bay Builders Developers Thiruvallur 32 Apartments 2 BHK 950 to 1,100 3 BHK 1,250
Lemongrass Green Leaves Estates Hotels Porur 16 Apartments 1 BHK 614 to 652 2 BHK 934 to 993 3 BHK 1,063 to 1,389
Queen's Court Selvi Constructions Kottivakkam 12 Apartments 2 BHK 973 to 1,054 3 BHK 1,564 to 1,604
Malles Vijayadhwajam Malles Constructions T. Nagar 8 Apartments 3 BHK 1,481 to 1,810
Peacock Enclave Dev Apartments Neelankarai 8 Villas 4 BHK 3,050
MM Seaview MS Charan Builders Kottivakkam 6 Apartments 3 BHK 1,331 to 2,674
Casamia Selvi Constructions Kottivakkam 6 Apartments 3 BHK 1,562 to 2,247
Oyester Rojavanam Oyester Homes Ayanavaram 5 Apartments 1 BHK 600 2 BHK 780
Estimated and as per market information Under
Construction Residential Property Update
Nearly 25,000 units are currently under
construction across various segments that may be
available for possession by the end of this year.
More than 81 of such units are in the mid
segment, followed by the affordable segment
(13). Nearly
50 of such units are spread across suburban and
peripheral submarkets of GST Road, Rajiv Gandhi
Salai (I) and II) and suburban areas near OMR and
Velachery.
19
Commercial Office Sector As new supply influx
remained sparse in prominent suburban
submarkets, existing availabilities in
Peripheral South-west (42) and North-west (17)
witnessed maximum share in Grade A net
absorption as demand remained healthy, despite
slow execution of expansion plans by some large
occupiers. Huge supply influx led to a
0.7 percentage point uptick in overall vacancy
that rose to 14.4 at the end of this quarter.
Weighted average rentals increased by 4 over
the previous quarter largely due to an 8 rental
uptick in Suburban South as premium spaces
started quoting higher rentals in the wake of
limited vacancy.
Retail Sector Strong demand for both established
main streets and standalone formats from
existing retailers as well as new entrants to
the city culminated in some large transactions.
Primarily jewellery and hypermarket
retailer categories fuelled demand for main
street locations rentals remained stable as
demand was fulfilled atrates similarto the
previous quarter.
Outlook Nearly 3,800 residential units are
currently under soft launch and maybe launched
during the latter half of the year. Improvements
in physical infrastructure, such as inauguration
of parts of Phase I of Metro Rail and road
widening of the East Coast Road (ECR) may act as
a catalyst and help improve new launches during
the next quarter, especially in locations such as
Alandur, Koyambedu, Guindy, Kodambakkam and
parts of East Coast Road (ECR).
cause an upward bias in overall vacancy in the
city. Modest availability of IT-SEZ developments
coupled with continual demand from occupiers may
lead to rental uptick in select submarkets such
as Suburban South and South-west.
Whilst no new mall influx is expected during the
next quarter, mall vacancy may revise downwards
as demand from apparels and food and beverages
(FB) categories may improve going forward.
However, rentals may hold steady. In the wake of
healthy demand, select main streets such as Anna
Nagar 2nd Avenue and Pondy Bazar may witness an
upward rental bias due to retailers preference
for these locations.
During the next quarter, supply infusion in
office sector may remain high as new
developments admeasuring nearly 1. 3 msf may
become operational. Approximately 87 of the
anticipated new supply belongs to Peripheral
South that may
20
Delhi - National Capital Region (NCR)
Market Overview
READY RESIDENTIAL PROPERTY VALUES IN JUNE'15
Delhi-NCR witnessed launch of approximately
6,900 units in the second quarter of 2015,
registering a 1.5 times increase over the
previous quarter. The surge in new unit launches
is due to large-scale projects that were
launched in Sohna, Gurgaon during the quarter.
Capital values maintained status quo during the
quarter across most submarkets in Delhi- NCR.
With stable demand, rental values also remained
stable across all submarkets. In the second
quarter of 2015, Grade A office supply in
Delhi-NCR was recorded at 2.5 msf, a 20.8
increase from the previous quarter. As compared
to the first quarter of 2015, net absorption
increased by 111 this quarter and was noted
close to 1.3 msf. No pre-commitments were noted
during the second quarter of 2015. Rental values
firmed up significantly in the submarkets of
Gurgaon CBD and Noida. No new mall supply was
added during the second quarter of 2015.
However, overall mall vacancy
Represents Mid and High End segments
Source Cushman Wakefield Research
increased marginally by 0.1 percentage points to
14.5 during the quarter. Rental values in malls
as well as main street locations remained stable
from the previous quarter. Main street locations
across Khan Market, Greater Kailash and South
Extension witnessed healthy take up of space.
Trends Updates Ready Residential Property
Update Due to subdued transaction activity,
capital values across all segments in various
submarkets remained stable from the previous
quarter. Capital values in the luxury segment in
Gurgaon increased by 3 from the
previous quarter amidst strong demand from
investors. The notification of Land Pooling
Policy by Delhi Development Authority is
expected to augment new supplyin submarkets of
Delhi.
21
Average Capital Values High-end Segment (INR '000/sf) Average Capital Values High-end Segment (INR '000/sf) Average Capital Values High-end Segment (INR '000/sf) Average Capital Values High-end Segment (INR '000/sf) Average Capital Values High-end Segment (INR '000/sf) Average Capital Values High-end Segment (INR '000/sf)
Location 2012 2013 2014 1Q 2015 2Q 2015
South-West 50.0 - 60.0 45.0 - 60.0 42.5 - 56.0 42.5 - 57.5 42.5 - 57.5
South-East 25.0 - 45.0 25.0 - 40.0 25.0 - 38.0 25.0 - 40.0 25.0 - 40.0
South Central 27.0 - 50.0 27.0 - 50.0 27.0 - 46.0 27.0 - 48.0 27.0 - 48.0
Central 60.0 - 80.0 60.0 - 90.0 60.0 - 90.0 60.0 - 90.0 60.0 - 90.0
Gurgaon 10.5 - 32.0 11.0 - 27.5 11.0 - 25.0 11.0 - 25.0 11.0 - 26.0
Noida 6.2 - 8.1 7.0 - 8.5 7.5 - 9.0 7.0 - 8.5 7.0 - 8.5
Source Cushman and Wakefield Research Note The
above values for high-end segment typically
include units of 2,000-4,000 sf
Average Capital Values Mid Segment (INR '000/sf) Average Capital Values Mid Segment (INR '000/sf) Average Capital Values Mid Segment (INR '000/sf) Average Capital Values Mid Segment (INR '000/sf) Average Capital Values Mid Segment (INR '000/sf) Average Capital Values Mid Segment (INR '000/sf)
Location 2012 2013 2014 1Q 2015 2Q 2015
South-East 25.0 - 30.0 25.0 - 30.0 22.0 - 27.0 22.5 - 27.5 22.5 - 27.5
South Central 25.0 - 35.0 25.0 - 35.0 25.0 - 35.0 25.0 - 35.0 25.0 - 35.0
Gurgaon 6.8 - 10.5 7.5 - 11.5 8.0 - 10.0 7.5 - 9.5 7.5 - 9.5
Noida 4.3 - 6.2 5.0 - 6.0 5.0 - 6.5 5.0 - 6.0 5.0 - 6.0
Source Cushman and Wakefield Research Note The
above values for mid segment typically include
units of 1,600-2,000 sf
Key to Locations High-end Segment South-west
Shanti Niketan, Westend, Anand Niketan, Vasant
Vihar, etc. South-east Friends Colony East,
Friends Colony West, Maharani Bagh, Greater
Kailash I, Greater Kailash II,
etc. South-central Defence Colony, Anand Lok,
Niti Bagh, Gulmohar Park, Hauz Khas Enclave,
Safdarjung Development Area, Mayfair Gardens,
Panchsheel Park, Soami Nagar, Sarvaodaya
Enclave, etc. Central Jorbagh, Golf Links,
Amrita Shergil Marg, Aurangzeb Road, Prithviraj
Road, Sikandara Road, Tilak Marg, Ferozshah
Road, Mann Singh Road, Sunder Nagar, Nizamuddin,
Tees January Marg, Chanakyapuri,
etc. Gurgaon-Luxury Golf Course Road (Sectors
26, 26A, 27, 28, 42, 43, 53-56) Gurgaon-High
end Golf Course Road (Sectors 24-26, 26A, 27,
28, 42, 43, 53-56), Mehrauli-Gurgaon Road
(Sectors 24-26) Golf Course Extension Road
(Sectors 58- 63, 63A, 65-67 and 67A), Sohna Road
(Sectors 38, 47- 49), Central Gurgaon (Sectors
40, 41, 44-46, 50-52 and 57) and Dwarka
Expressway (Sectors 99, 99A, 102, 102A, 103-110,
110A, 111-114) Noida Sectors 34-37, 39-41, 44,
50, 51, 92, 93, 96-98, 128 and 133
Mid Segment South-east New Friends Colony,
Kalindi Colony, Ishwar Nagar, Sukhdev Vihar,
Kailash Colony, Pamposh Enclave,
etc. South-central Uday Park, Green Park, Saket,
Asiad Village, Geetanjali Enclave, Safdarjung
Enclave, Sarvapriya Vihar, Panchsheel Enclave,
Navjeevan Vihar, etc. Gurgaon Sohna Road
(Sectors 38, 47-49), Southern Peripheral Road
(Sectors 68-70, 70A, 71-73), New Gurgaon
(Sectors 76-81, 81A, 82, 82A, 83-86, 88, 88A,
88B, 89, 89A, 90-93, 95, 95A and 95B) Dwarka
Expressway (Sectors 99, 99A, 102, 102A, 103-110,
110A, 111-114) and Sohna Noida Sectors 50,
74-79, 82, 83, 110, 112, 115-121, 134,
135, 137, 143, 150, 151 and 168), Greater Noida
and Yamuna Expressway
22
New Residential Launches With approximately 6,900
unit launches, the second quarter of 2015
witnessed a 1.5 times increase in launches over
the previous quarter. Nearly 62 of units
launched during the quarter were in the
affordable segment and the remaining in the mid
segment. Gurgaon accounted for around 57 of the
total unit launches, with a majority in the
affordable segment in Sohna and the mid segment
launches in the submarkets of Southern Peripheral
Road, New Gurgaon and Dwarka Expressway. Noida
Extension continued to witness launches in
affordable segment while launches along Noida
Expressway were in the mid segment.
Project Name Developer Location Number of Units Type Area of Units (in sf)
Resortico CHD Developers Sector 34, Sohna 1,379 Apartments 1 BHK 709
Hill Town Supertech Sector 2, Sohna 1,324 Apartments 2 BHK 1,200 to 1,440 3 BHK 1,685 to 2,225 4 BHK 2,695
Ace Parkway Ace Group Sector 150, Noida 970 Apartments 2 BHK 1,310 to 1,360 3 BHK 1,750 to 2,460 4 BHK 3,220
Ophira Mangalya Group Sector 1, Greater Noida (West) 924 Apartments 2 BHK 1,025 to 1,250 3 BHK 1,455
M3M Marina M3M Sector 68, Gurgaon 760 Apartments 2 BHK 1,304 3 BHK 1,595 to 1,914
Ratan Pearls Ratan Buildtech Sector 16, Greater Noida (West) 624 Apartments 2 BHK 1,035 to 1,189 3 BHK 1,370 to 1,900
F Premiere Home Soul Yamuna Expressway 412 Apartments 2 BHK 1,490 to 1,640 3 BHK 1,779 to 1,835 4 BHK 4,008
37th Avenue Imperia Structures Sector 37C, Gurgaon 300 Apartments 1 BHK 600 2 BHK 900
Icon Godrej Properties Sector 88A, Gurgaon 200 Apartments 2 BHK 1,617 to 1,630 3 BHK 1,365 4 BHK 1,595
Estimated and as per market information
Under Construction Residential Property Update
Developers continued offering phase-wise
possession in projects across submarkets. Under-
construction projects in Noida Extension, which
were stuck in petitions challenging the land
acquisition, received a boost after the Supreme
Court quashed all petitions. Projects on Dwarka
Expressway also witnessed healthy pick-up in
construction activity after the State High
Court
vacated its stay on the construction work on the
expressway. A 2-km stretch of Dwarka Expressway
was caught in land acquisition litigation and the
court had earlier ordered a stay on construction
activity of the expressway. However, the
National Green Tribunal imposed a ban on
construction activity on several projects for
flouting pollution norms in Noida Extension.
23
Commercial Office Sector Grade A office supply in
Delhi-NCR was recorded at 2.5 msf in the second
quarter of 2015, a 20.8 increase from the
previous quarter. Commercial developments
accounted for 87.2 of this new supply followed
by IT-SEZs with a 12.8 share. The quarter
witnessed net absorption of over 1.3 msf in
Grade A developments, a 111 increase from the
previous quarter. The IT-ITeS sector had the
highest share (67), followed by healthcare (7)
and the consulting sectors (5). No
pre-commitments were noted during the quarter.
Led by a surge in supply along with high
relocations and consolidation by occupiers, the
overall vacancy in Grade A developments increased
by 0.7 percentage points and was noted at 27.8.
The weighted average Grade A rentals in Gurgaon
CBD increased by over 4.5 amidst strong demand
and limited availability. Weighted average
rentals in Noida increased by over 27.2 due to
fresh addition of premium spaces at higher
rentals.
Retail Sector Overall mall vacancy levels was
recorded at 14.5, increasing by 0.1 percentage
point over the previous quarter. The increase
was primarily due to tepid demand and exit by
several vanilla retailers in a mall in West
Delhi. The demand for space in malls was driven
mainly by retailers from food and beverage
(FB), apparel and accessories brands. Some of
these retailers include, Carls Jr., HM, W and
GAP to name a few. Low levels of churn resulted
in rental values maintaining status quo during
the second quarter of 2015, although rentals in
select prominent malls increased. Apparels, FB
and footwear brands, which continued to
strengthen their presence across various
locations, mainly drove the demand in main
street locations. Few of the brands that took up
space during the quarter include Farzi Café,
Café Coffee Day, Bear Café, Nike, W and Madame.
Outlook Considering that currently, only a few
projects are in pre-launch stage, new unit
launches are likely to decline in the next
quarter. As transaction activity is likely to
remain subdued, capital values across submarkets
in Delhi-NCR are expected to remain stable
during the next quarter. With the Delhi
government pushing for re-categorization of areas
for demarcation of circle rates, a revision is
expected soon. Several projects nearing
completion in the submarkets of Noida and
Gurgaon are expected to begin possession in the
coming quarters.
this surge in supply is likely to lead to an
increase in overall vacancy levels. Rental
values are expected to further strengthen in
Gurgaon CBD due to strong demand and limited
availability.
Nearly 3.6 msf of new mall supply is scheduled
for completion in the next quarter across Noida,
South Delhi and West Delhi, which is likely to
put pressure on rentals owing to increased
vacancy levels. During the next quarter, rentals
across most main street locations are expected
to remain stable. Prominent main street
locations such as Connaught Place and Sector 29,
Gurgaon will continue to see strong interest
from retailers especially from FB segment.
Approximately 3.8 msf of office space is
scheduled for completion during the next quarter,
primarily in Gurgaon. Despite sustained
absorption,
24
Hyderabad
Market Overview
- During the second quarter of 2015, Hyderabad
witnessed the launch of nearly 1,140 residential
units, a decline of 66 over the previous quarter
due to the absence of large township projects
that were witnessed in the previous quarter. Of
the total units launched, Madhapur, Gachibowli
in the north- western quadrant of the city
accounted for 71 share. Land availability
coupled with ease of access to prominent
business parks via the Outer Ring Road continue
Recommended
CrystalGraphics Presentations


