
Mass spectrometry - PowerPoint PPT Presentation
1 / 20
Title:
Mass spectrometry
Description:
balance as ion goes through flight tube. Fundamental equation of mass spectrometry ... PRO: cheap, fast, easy. Magnetic Sector: Changes B and V to focus. a ... – PowerPoint PPT presentation
Number of Views:677
Avg rating:3.0/5.0
Title: Mass spectrometry
1
Mass spectrometry Error Analysis 9/24/07
What are the principles behind MS? What do all
MS instruments have in common? What are the
different types of MS? How are errors handled in
isotope geochemistry?
- Lecture outline
- Introduction to mass spectrometry
- sample introduction systems, mass
- analyzers
- 3) popular combinations in biogeochemistry
- 4) handling errors in mass spectrometry
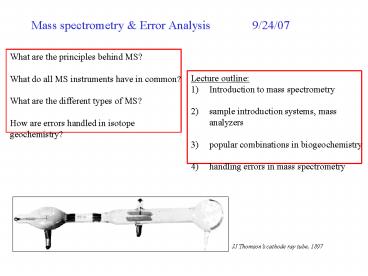
JJ Thomsons cathode ray tube, 1897
2
Introduction to Mass Spectrometry
Sample introduction
Count ions
Separate masses
Collect results
Ionization
Minimize collisions, interferences
Nier-type mass spec
3
Basic equations of mass spectrometry
Ions kinetic E function of accelerating voltage
(V) and charge (z).
Centrifugal force
Applied magnetic field
balance as ion goes through flight tube
Combine equations to obtain
Fundamental equation of mass spectrometry
Change mass-to-charge (m/z) ratio by changing V
or changing B. NOTE if B, V, z constant,
then
4
If B in gauss r in centimeters m in amu V in
volts z in electronic charge then. What
magnetic field strength would be required to
focus a beam of CO2 ions on a collector of a
mass spectrometer whose analyzer tube as a radius
of 31.45cm, assuming a voltage of 1000V? Change
your magnetic field strength by -10, what
voltage puts the CO2 ions into the collector?
5
Examples of mass spec data output
Ex B
You can scan in B or V to sweep masses across a
single detector.
OR
You can put different masses into multiple cups
without changing B or V.
6
Sample Introduction Systems (aka front ends)
1) Gas source (lighter elements) dual inlet -
sample purified and measured with standard gas at
identical conditions precisions
0.005 continous flow - sample volatized and
purified (by EA or GC) and injected into mass
spec in He carrier gas, standards measured before
and after, precisions 0.005-0.01 2) Solid
source (heavier elements) TIMS - sample loaded
onto Re filament, heated to 1500C, precisions
0.001 laser ablation - sample surface sealed
under vacuum, then sputtered with
laser precisions 0.01? 3) Inductively
coupled plasma (all elements, Li to U) ICPMS -
sample converted to liquid form, converted to
fine aerosol in nebulizer, injected into 5000K
plasma torch
7
Ionization occurs in the source
Electron Ionization
Gas stream passes through beam of e-, positive
ions generated.
Thermal Ionization
Plasma Gas stream passes through
plasma maintained by RF current and Ar.
Themal Filament heated to 1500C
8
Mass Analyzers - the quadrupole vs. magnetic
sector
Quadrupole Changes DC and RF voltages to
isolate a given m/z ion. PRO cheap, fast, easy
Magnetic Sector Changes B and V to focus a given
m/z into detector. PRO turn in geometry
means less dark noise, higher precision,
9
Popular combinations
Gas source 1) Dual inlet isotope ratio mass spec
(at GT, Lynch-Steiglitz and Cobb) - O, C, H
ratio analyses 2) Elemental analyzer IRMS (at
GT, Montoya) - N, C, S ratio analyses 3) Gas
chromatograph IRMS (at GT, ????) -
compound-specific ratio analyses Solid source 1)
Thermal Ionization mass spec (multi-collector) -
heavy metals, REE ICP 1) ICP quadrupole mass
spec (at GT, Taillefert) - trace metal
analysis 2) Single collector magnetic sector
ICPMS - higher-precision trace metal
analysis 2) Multi-collector ICPMS - U/Th
dating, TIMS replacement
Micromass IsoProbe - MC-ICPMS
10
Hurdles in mass spectrometry (cont.)
3) Dark Noise - detector will register signal
even without an ion beam - no vacuum is
perfect and - no detector is perfect - must
measure prior to run, acceptable values
3-10cpm
4) Detector gain - what is the relationship
between the electronic signal recorded by the
detector and the number of ions that it has
counted? - usually close to 1 after factory
testing - changes as detector ages - must
quantify with standards
Cardinal rule of mass spectrometry Your
measurements are only as good as your
STANDARDS! Standards (both concentration and
isotopic) can be purchased from NIST
11
Ex NBS-19, O, C carbonate isotopic standard
Cardinal rule of mass spectrometry Your
measurements are only as good as your
STANDARDS! Standards (both concentration and
isotopic) can be purchased from NIST
12
Designing an analytical strategy for isotopic
analysis
- How much material do you have available for
analysis? - - often set by external factors (no sample is
unlimited) - What is the expected concentration of the
isotopes of interest? - What is the error on the isotope ratio expected
from counting statistics? - What are the other sources of error?
- - blanks (know the sources of contamination and
their isotopic signatures) - Is the expected/desired isotopic signal larger
than the sum of all expected errors? - yes? proceed
- no? back to square one can you use more
sample? limit blanks? etc - What instrument will deliver you the required
precision? - What particular sources of error are associated
with this analysis technique? - - poor yield from sample injection to detection
(lowers N) - - mass fractionation, abundance sensitivity, etc
13
A review of terms
accuracy how close the measurement is to a true
value precision how well we can measure
something analytically Good science quote
values that are accurate within the precision
Systematic error cannot be assessed by repeated
measurements (ex?) Random error can be
assessed by repeated measurements (ex?)
Internal error measure ratio repeatedly, assess
scatter (aka precision) External error compare
measurements of standards with internal
errors to truth (aka accuracy)
14
Systematic error
Examples detector gain (only counts a fraction
of signal, usually close to 1) uncorrected blank
or memory wrong mass discrimination law
assumed spike calibration not accurate
- Reducing systematic errors
- minimize systematic errors, add them to random
errors - make sure systematic errors are small compared to
random errors (lt10) - measure unknowns relative to a standard so
systematic errors cancel out - Different applications require different
approaches (2 3 most popular in mass spec work)
How do you hunt for systematic errors?
15
Random error
Internal error derives from imperfect
measurement (collector noise, electronic noise,
etc) measure ratio repeatedly and use scatter to
assess uncertainty
External error the ability to reproduce
standards over many runs (why might this change
long-term?) measure standard repeatedly, over a
very long time cite as 2 s.d. and mention how
many standards based on Ex. External
reproducibility was assessed with repeated
measurements of the NBS-19 carbonate standard,
and is reported as 0.05 (2 s.d., N550).
16
Example U isotope ratios in single run
Statistic 1) mean 140.0833 2) standard
deviation (1s) 0.038 variance (s)2 3)
standard error (1s) 0.0027 4) relative
standard error (1s) 1.93 x 10⁻⁵
What is the 238U/235U ratio in nature?
What sources of error are implicit in this plot?
17
The Gaussian, or normal distribution
18
Fun with Gaussian statistics
How many measurements should fall outside the
2s boundaries?
Would the distribution for many standard runs be
greater or smaller than for individual runs?
How could you test whether a process is Gaussian?
Would the shape of this distribution change
with more measurements?
Whats limiting the precision of this measurement?
19
A note on error propagation
Addition and subtraction add absolute
errors Example subtracting a blank blank 230
20 pg 230Th measurement 3532 50 pg
230Th blank-corrected 230Th 3302 70 pg 230Th
multiplication and division add fractional
(relative) errors Example correcting value for
mass discrimination by normalizing to standard
value mass discrimination std ratio(meas) / std
ratio(true) 1.003322 0.01 unknown ratio
1932 10 or 1932 0.52 m.d.-corrected ratio
1926 0.53 But what about multiple sources
of error? errors from. mass spectrometry 2 s.d.
external weighing 2 s.d. of repeat measurements
on balance spike calibration 2 s.d. of repeat
spike calibration attempts blank correction 2
s.d. of blank variability IF errors are
unrelated (orthogonal) no error correlation
(examples?) then combine errors quadratically
20
A reminder about significant figures
- Number of significant figures
- leftmost nonzero digit is the most significant
digit - if there is no decimal point, rightmost nonzero
digit is the least significant digit - if there is a decimal point, the rightmost digit
is the least significant digit (0 included) - all digits between the least and most significant
digits are counted as significant digits - Example
- How many significant figures in the following
numbers? - 1234
- 123,400
- 123.4
- 1001
- 10.10
- 0.0001010
- 100.0
- NOTE When performing calculations with data,
the number of significant figures in the answer - must be equal to the smallest number of
significant figures in the input data - Rules for reporting data
Recommended
CrystalGraphics Presentations


