
Environmental Product Declaration - PowerPoint PPT Presentation
Title:
Environmental Product Declaration
Description:
This document covers PVC pressure pipe for potable water, reclaimed water, and sewer forcemain systems; and PVC non-pressure pipe for storm sewer and sanitary sewer systems. All pipes are made in lengths that are assembled at the job site. – PowerPoint PPT presentation
Number of Views:58
Title: Environmental Product Declaration
1
Environmental Product Declaration
Uni-Bell PVC Pipe Association PVC Pressure
Pipe Potable Water, Reclaimed Water, Sewer Force
Main PVC Non-Pressure Pipe Sanitary Sewer and
Storm Sewer Pipe Systems
Uni-Bell PVC Pipe Association PVC Pressure
Pipe Potable Water, Reclaimed Water, Sewer Force
Main PVC Non-Pressure Pipe Sanitary Sewer and
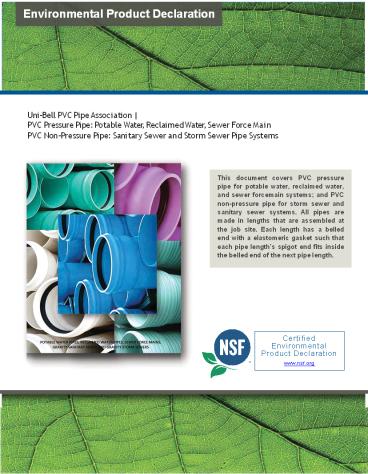
Storm Sewer Pipe Systems ENVIRONMENTAL PRODUCT
DECLARATION VERIFICATION e This document
covers PVC pressure pipe for potable water,
reclaimed water, and sewer forcemain systems
and PVC non-pressure pipe for storm sewer and
sanitary sewer systems. All pipes are made in
lengths that are assembled at the job site. Each
length has a belled end with a elastomeric
gasket such that each pipe lengths spigot end
fits inside the belled end of the next pipe
length.
This document covers PVC pressure pipe for
potable water, reclaimed water, and sewer
forcemain systems and PVC non-pressure pipe for
storm sewer and sanitary sewer systems. All
pipes are made in lengths that are assembled at
the job site. Each length has a belled end with
a elastomeric gasket such that each pipe
lengths spigot end fits inside the belled end
of the next pipe length.
Certified Environmental Product
Declaration www.nsf.org
Environmental Product Declaration Program Date of
Issue Month, X, 20XX Operator Period of
Validity X years NSF International Declaration
123456 789 N. Dixboro Rd. Ann Arbor MI 48105 USA
www.nsf.org
2
Environmental Product Declaration
ENVIRONMENTAL PRODUCT DECLARATION VERIFICATION
EPD Information EPD Information EPD Information EPD Information EPD Information
Program Operator Program Operator Program Operator NSF International NSF International
Declaration Holder Declaration Holder Declaration Holder Uni-Bell PVC Pipe Association Uni-Bell PVC Pipe Association
Product Potable Water, Gravity Storm Water, and Sanitary Sewer Pipe Systems Product Potable Water, Gravity Storm Water, and Sanitary Sewer Pipe Systems Date of Issue May 15, 2015 Period of Validity 5 Years Declaration Number EPD10047
This EPD was independently verified by NSF International in accordance with ISO 14025 Internal External This EPD was independently verified by NSF International in accordance with ISO 14025 Internal External This EPD was independently verified by NSF International in accordance with ISO 14025 Internal External
This EPD was independently verified by NSF International in accordance with ISO 14025 Internal External This EPD was independently verified by NSF International in accordance with ISO 14025 Internal External This EPD was independently verified by NSF International in accordance with ISO 14025 Internal External Lori Bestervelt LBestervelt_at_nsf.org Lori Bestervelt LBestervelt_at_nsf.org
This life cycle assessment was independently verified by in accordance with ISO 14044 and the reference PCR This life cycle assessment was independently verified by in accordance with ISO 14044 and the reference PCR This life cycle assessment was independently verified by in accordance with ISO 14044 and the reference PCR
This life cycle assessment was independently verified by in accordance with ISO 14044 and the reference PCR This life cycle assessment was independently verified by in accordance with ISO 14044 and the reference PCR This life cycle assessment was independently verified by in accordance with ISO 14044 and the reference PCR J. Renée Morin, PRé morin_at_pre-sustainability.com J. Renée Morin, PRé morin_at_pre-sustainability.com
LCA Information LCA Information LCA Information LCA Information LCA Information
Basis LCA Potable Water, Gravity Storm Water, and Sanitary Sewer Pipe Systems, October 18, 2013 Potable Water, Gravity Storm Water, and Sanitary Sewer Pipe Systems, October 18, 2013 Potable Water, Gravity Storm Water, and Sanitary Sewer Pipe Systems, October 18, 2013 Potable Water, Gravity Storm Water, and Sanitary Sewer Pipe Systems, October 18, 2013
LCA Preparer James Mellentine, Sustainable Solutions Corporation Cara Watson, Sustainable Solutions Corporation James Mellentine, Sustainable Solutions Corporation Cara Watson, Sustainable Solutions Corporation James Mellentine, Sustainable Solutions Corporation Cara Watson, Sustainable Solutions Corporation James Mellentine, Sustainable Solutions Corporation Cara Watson, Sustainable Solutions Corporation
This life cycle assessment was critically reviewed in accordance with ISO 14044 by Rita Schenck, Ph.D. LCACP (Review Chair), Executive Director, Institute for Environmental Research and Education Nigel Howard, Managing Director, Clarity Environment Charlie He, Associate Vice President, Carollo Engineering Rita Schenck, Ph.D. LCACP (Review Chair), Executive Director, Institute for Environmental Research and Education Nigel Howard, Managing Director, Clarity Environment Charlie He, Associate Vice President, Carollo Engineering Rita Schenck, Ph.D. LCACP (Review Chair), Executive Director, Institute for Environmental Research and Education Nigel Howard, Managing Director, Clarity Environment Charlie He, Associate Vice President, Carollo Engineering Rita Schenck, Ph.D. LCACP (Review Chair), Executive Director, Institute for Environmental Research and Education Nigel Howard, Managing Director, Clarity Environment Charlie He, Associate Vice President, Carollo Engineering
PCR Information PCR Information PCR Information PCR Information PCR Information
Program Operator The Norwegian EPD Foundation, with Addendum by UL Environment The Norwegian EPD Foundation, with Addendum by UL Environment The Norwegian EPD Foundation, with Addendum by UL Environment The Norwegian EPD Foundation, with Addendum by UL Environment
Reference PCR Piping systems for use for sewage and storm water (under gravity), The Norwegian EPD Foundation, with Addendum v2 by UL Environment Piping systems for use for sewage and storm water (under gravity), The Norwegian EPD Foundation, with Addendum v2 by UL Environment Piping systems for use for sewage and storm water (under gravity), The Norwegian EPD Foundation, with Addendum v2 by UL Environment Piping systems for use for sewage and storm water (under gravity), The Norwegian EPD Foundation, with Addendum v2 by UL Environment
Date of Issue 9/20/2012 (Addendum 6/10/2014) 9/20/2012 (Addendum 6/10/2014) 9/20/2012 (Addendum 6/10/2014) 9/20/2012 (Addendum 6/10/2014)
PCR review was conducted by The Norwegian EPD Foundation PB 5250 Majorstuen, 0303 Oslo The Norwegian EPD Foundation PB 5250 Majorstuen, 0303 Oslo The Norwegian EPD Foundation PB 5250 Majorstuen, 0303 Oslo The Norwegian EPD Foundation PB 5250 Majorstuen, 0303 Oslo
EPD Program Operator NSF International 789 N.
Dixboro Rd. Ann Arbor MI 48105 USA
www.nsfsustainability.org
3
Environmental Product Declaration
ENVIRONMENTAL PRODUCT DECLARATION DETAILED
VERSION Terms and Definitions/ Definition of
Product Category The PVC pipe industry recognizes
the benefits of communicating credible,
science-based and transparent environmental
information about its products. This document
provides a baseline for 100 feet of seven
different pipe products, used in various
applications, to assist with measuring and
understanding the environmental impacts of PVC
pipe across the life cycle. The seven PVC pipe
products examined are used for both pressure
applications (potable water pipes, reclaimed
water pipes and sewer force mains), and
non-pressure applications (gravity sanitary sewer
and gravity storm sewers). These products are
listed below in Table 1.
Application Standard Nominal Diameter Dimension Ratio/ Pipe Stiffness
Pressure Pipe AWWA C9001 8 in. DR18
Pressure Pipe AWWA C900 8 in. DR25
Pressure Pipe AWWA C9052 CIOD 24 in. DR25
Storm Water ASTM F7943/ AASHTO M3044 24 in. (profile wall) PS 46
Sanitary Sewer ASTM F794 8 in. (profile wall) PS 46
Sanitary Sewer ASTM D30345 8 in. (solid wall) DR35 (PS 46)
Sanitary Sewer ASTM F6796 24 in. (solid wall) PS 46
Table 1. Products Included in Study
1 AWWA C900 Standard for Polyvinyl Chloride (PVC)
Pressure Pipe and Fabricated Fittings, 4 in.
through 12 in., For Water Transmission and
Distribution. 2007. 2 AWWA C905 Standard for
Polyvinyl Chloride (PVC) Pressure Pipe and
Fabricated Fittings, 14 in. through 48 in., For
Water Transmission and Distribution. 2010. 3
ASTM F794 Standard Specification for Poly(Vinyl
Chloride) (PVC) Profile Gravity Sewer Pipe and
Fittings Based on Controlled Inside Diameter.
2014 4 AASHTO M304 Standard Specification for
Poly(Vinyl Chloride) (PVC) Profile Wall Drain
Pipe and Fittings Based on Controlled Inside
Diameter. 2011 5 ASTM D3034 Standard
Specification for Type PSM Poly(Vinyl Chloride)
(PVC) Sewer Pipe and Fittings. 2014 6 ASTM F679
Standard Specification for Poly(Vinyl Chloride)
(PVC) Large Diameter Plastic Gravity Sewer Pipe
and Fittings. 2013
EPD Program Operator NSF International 789 N.
Dixboro Rd. Ann Arbor MI 48105 USA
www.nsfsustainability.org
4
Environmental Product Declaration
This study uses data from seven manufacturers and
21 facilities to represent roughly 20 of all PVC
pipe product capacity in the United States and
Canada. The participating manufacturers are
listed in Table 2 and include
Participating PVC Pipe Manufacturers
Diamond Plastics Corporation
IPEX, Inc.
National Pipe Plastics Corporation
North American Pipe Corporation
North American Specialty Products
PipeLife JetStream, Inc.
Royal Building Products
Table 2. Participating Manufacturers The terms
defined by the PCR are listed below Environmenta
l Product Declaration (EPD) environmental
declaration providing quantified environmental
data using predetermined parameters and, where
relevant, additional environmental
information Functional Unit the quantified
performance of a product system for use as
reference unit Life Cycle Assessment (LCA)
compilation and evaluation of the inputs, outputs
and the potential environmental impacts of a
product system throughout its life cycle Life
Cycle Costing (LCC) investigation and evaluation
of economic costs of a product or service from
cradle to grave Product Category Rule (PCR)
a set of specific rules, requirements and
guidelines for developing Type III environmental
declarations for one or more product
categories Pressure Pipe pipe for pressurized
transport of potable water, reclaimed water, or
sewage. Non-Pressure Pipe pipe for non-pressure
transport of sanitary sewage or drainage
water. Piping system function the function of
the pipe is to transport (via gravity or
pressure) a certain amount of liquid or sewage
from a source location to a destination location
EPD Program Operator NSF International 789 N.
Dixboro Rd. Ann Arbor MI 48105 USA
www.nsfsustainability.org
5
Environmental Product Declaration
Functional Unit/Reference Service Life The
environmental impacts are reported per functional
unit of a product and the functional unit is the
basis for comparison in an LCA. For PVC pipe, the
functional unit is 100 feet of installed pipe
over a 100 year lifetime, as pipe length is a
more useful functional unit than weight. To
calculate the environmental impacts for 100
meters of installed pipe, multiply these EPD
results by 3.28 feet per meter. The pumping
energy required to pump water through the pipe
during the use stage is considered and reported
separately from the rest of the life cycle, since
operating conditions can vary. System
Boundaries The system boundary of this EPD is
cradle-to-grave. This project considers the life
cycle activities from resource extraction
through installation and end-of-life effects. The
boundary covers the product, construction
process, use, and end of life stages, as seen in
Figure 1.
Figure 1. System Boundary
EPD Program Operator NSF International 789 N.
Dixboro Rd. Ann Arbor MI 48105 USA
www.nsfsustainability.org
6
Environmental Product Declaration
- Criteria for the inclusion of inputs and outputs
(cut-off) - Processes whose total contribution to the final
result, in relation to all considered impact
categories, is less than 1 can be neglected.
The sum of the neglected processes may not exceed
5 by mass of the considered impact categories.
If 5 is exceeded, a documented assumption is
admissible. - For Hazardous Substances, as defined by the U.S.
Occupational Health and Safety Act, the following
requirements apply - The Life Cycle Inventory (LCI) of hazardous
substances will be included, if the inventory is
available. - If the LCI for a hazardous substance is not
available, the substance will appear as an input
in the LCI of the product, if its mass
represents more than 0.1 of the product
composition. - If the LCI of a hazardous substance is
approximated by modeling another substance,
documentation will be provided. - This LCA/EPD is in compliance with the cut-off
criteria since no known processes were neglected
or excluded from this analysis outside of the
specific items listed below - Construction of capital equipment
- Maintenance of operation and support equipment
- Human labor and employee commute
- Ink for printing pipe label
- Casings for pipe installed under structures
- Fittings
- Shoring, soil compaction during installation of
pipe - Molecularly oriented PVC (PVCO) analysis
- Water consumption analysis
EPD Program Operator NSF International 789 N.
Dixboro Rd. Ann Arbor MI 48105 USA
www.nsfsustainability.org
7
Environmental Product Declaration
Raw Materials Extraction and Origin PVC pipe
compound ingredients are given in the units Parts
per Hundred Resin (PHR). This means that for
every 100 pounds of resin, the PHR amount should
be added to the compound when mixing. This
ensures consistency throughout the industry. The
industry average PVC pipe formations are listed
in Table 3.
Raw Material Potable Water (PHR) Profile Sewer (PHR) Solid Wall Sewer (PHR)
PVC resin 100 100 100
Heat Stabilizer 0.69 2.26 0.57
Paraffin Wax 1.38 1.65 1.12
Calcium Carbonate 5.51 9.59 17.65
Calcium Stearate 0.72 0.70 0.84
Polyethylene Wax 0.21 0.22 0.15
Titanium Dioxide 0.83 1.03 1.11
Process Aid - 1.13 -
Impact Modifier - 5.30 -
Pigments 0.23 0.20 0.30
Total 109.75 122.06 121.74
Table 3. PVC Pipe Product Formulation The
average raw materials transportation distances
are listed in Table 4 for each pipe included in
the study.
Raw Materials Transportation (km) 8" DR18 C900 8" DR25 C900 24" DR25 C905 24" PS 46 (profile) 8" PS 46 (profile) 8" DR35 PS 46 24" PS 46
Rail 949 1,580 1,376 3,024 1,879 1,298 1,436
Truck 109 97 114 297 94 143 157
Ocean Freighter 35 90 1 200 71 31 18
Total 1,093 1,766 1,491 3,541 2,125 1,472 1,611
Table 4. PVC Pipe Raw Material Average Shipping
Distances
Production The production process begins when the
raw materials are blended together, after which
the compound flows into an electrically heated
extruder. The compound passes through a die at
the end of the extruder, where it is formed into
a pipe shape. The pipe then moves through a
sizing sleeve that provides dimensional
accuracy. Solid-wall pipe is then water cooled,
cut to length and labeled as the pipe moves to
the end of the production line. Profile-wall pipe
undergoes additional processing to form
EPD Program Operator NSF International 789 N.
Dixboro Rd. Ann Arbor MI 48105 USA
www.nsfsustainability.org
8
Environmental Product Declaration
the profile shape. At the end of the production
line, the pipe is belled and pressure tested (for
pressure rated pipes). The pipe is then packaged
and prepared for shipment from the manufacturing
facility. The packaging is typically a set of
wooden frames that hold the bundle of pipes
together. Packaged pipe is loaded onto trucks
for shipping. Transportation of pipes from
production site to location is included in the
production stage. The final PVC pipes are
shipped throughout the United States and Canada.
Each participating facility provided average
transportation distances for the products
investigated in this study. A weighted average
was taken for each product in this study as seen
in Table 5. All manufacturing facilities ship the
PVC pipe via truck.
8" DR18 Final Product Shipping C900 8" DR18 Final Product Shipping C900 8" DR25 C900 24" DR25 C905 24" PS 46 (profile) 8" PS 46 (profile) 8" DR35 PS 46 24 PS 46
Truck Shipments (km) 422 775 257 711 967 592 367
Table 5. Weighted Average of Final Product
Shipping from Manufacturing Facilities Installat
ion Installation of PVC pipe is assumed to be
similar to other open-cut pipe installation,
requiring the digging and refilling of a trench.
The trench depth and time required to dig and
re-fill it varies widely per region, soil type,
climate, existing infrastructure, equipment
operator, local convention, and other factors, so
the actual installation time and effort is
widely variable. For 8-inch pipe, the trench
width used was at least 24 inches. For 24-inch
pipe, the trench width should extend at least 36
inches. Typically, a hydraulic digger is used to
dig the trench, and a small loader re-fills the
trench. Scenarios Two scenarios were
identified for this study. The first scenario
represents a trench depth of 4 feet for the
8-inch diameter potable water pipe, with an
estimated 1.5 hours of machine run time for 100
feet of pipe. The second scenario represents a
trench depth of 10 feet for the 24-inch diameter
non-pressure pipe, with an estimated 2.5 hours
of machine run time for 100 feet of pipe. Diesel
fuel usage rates are estimated to be 8
gallons/hour for the digger7 and 2 gallons/hour
for the loader8. Therefore the 1.5-hour baseline
scenario assumes 15 gallons of diesel is required
to install 100 feet of pipe. The longer 2.5-hour
scenario assumes 36 gallons of diesel is required
to install 100 feet of
7 Forum on Heavy Equipment. http//www.heavyequipm
entforums.com/showthread.php?5804-Fuel-Consumption
Accessed March 2013. 8 Forum on Forestry Forum.
http//www.forestryforum.com/board/index.php?topic
14063.0. Accessed March 2013.
EPD Program Operator NSF International 789 N.
Dixboro Rd. Ann Arbor MI 48105 USA
www.nsfsustainability.org
9
Environmental Product Declaration
pipe. No shoring was required. Gravel and sand
was assumed to be used in the bedding and
haunching of the trench, per the Handbook of PVC
Pipe Design Construction manual. A combined
bulk density of 120 lb/ft3 was assumed9. Not all
pipe installations require bedding, and some
installations can use native soil.
igure 2. Trench Cros - ection Diagra Use (100
years) It is assumed that replacements or repairs
of pipes will not be necessary during the course
of 100 years. Pumping energy is required to
compensate for the friction against the water
flow caused from the inner wall of the pipes of
pressurized piping systems. To calculate the
amount of energy required of the pumps for the
friction head from the PVC pipe, the following
assumptions were made. Note that 8760 annual
operating hours equal 24-hour, 365-day pumping.
Figure 2. Trench Cross
Section Diagram
Parameter Value Parameter Value
Water flow velocity in PVC pipe 2 feet/second
Pump efficiency 75
Operating hours per year 8760
Length of pipe 100 feet
Elevation increase 0 feet
Hazen-Williams Coefficient for PVC 15010
9 SI Metric. Density of Dry Material
Table.http//www.simetric.co.uk/si_materials.htm
Accessed September 25, 2013. 10 Handbook of PVC
Pipe Design and Construction. Fifth Edition.
Uni-Bell. (2012) 9.7.
EPD Program Operator NSF International 789 N.
Dixboro Rd. Ann Arbor MI 48105 USA
www.nsfsustainability.org
10
Environmental Product Declaration
Table 6. Assumptions made for the use of potable
water pipe
T h e f r i c t i o n h e a d l of es es o f p i p e w a s c a l c u l a t e- d W i l l i a m s e q u a t i o n . 8 D R 1 A W WC 9A0 8 D R 2 A W WC 9A0 5 2 4 D R 2 0 A W WC 9A0 5
H a z-We ni l l i a m s C 1o1 e f f i c i e 1 5 0 1 5 0 1 5 0
I ns i d De i a m (ei nt ec rh ) 8 . 0 4 8 . 3 3 2 3 . 7 4
F l o Rw a t( ge p ma t )2 f t / s v e l o c 3 1 7 3 3 9 2 , 7 5 8
F r i c t i o nl oh s(esf at /d1 0 0 f t o f 0 . 1 7 0 . 1 4 0 . 0 5
P u m p i n g E n e r g y ( k W 1 1 5 9 8 2 8 6
Table 7 Assumptions for Use Phase Calculations
for Constant Velocity of 2 ft per second End of
Life The study assumes the service life is 100
years and the end-of-life disposition is modeled
as left in the ground. The selected service life
used in the project reflects the expert opinions
of the product manufacturers as well as the
AWWARF study and Utah State University study12
which confirms PVC pipe will last well over 100
years13. Infrastructure pipe is generally left in
the ground at the end of its service life, and
that is the assumption made in this study.
Disposal in a municipal landfill is permissible
and should be done in accordance with local,
state, and federal regulations. However, PVC pipe
is 100 recyclable so if the product is removed
from the ground after its service life, the
preferred disposition is recycling.
11 Handbook of PVC Pipe Design and Construction.
Fifth Edition. Uni-Bell. (2012) 9.7. 12 Folkman,
Steven. PVC Pipe Longevity Report Affordability
the 100 Year Benchmark Standard. Utah State
University Buried Structures Laboratory. May
2014. 13 Burn, S. et. al., Long-term Performance
Prediction for PVC Pipes, AWWARF Report 91092F,
May 2006.
EPD Program Operator NSF International 789 N.
Dixboro Rd. Ann Arbor MI 48105 USA
www.nsfsustainability.org
11
Environmental Product Declaration
Life Cycle Inventory Analysis Resources The use
of renewable and non-renewable material sources,
primary energy, and water are reported in the
tables below.
Resource (unit per 100 ft pipe for 100 yrs) Product Stage (A1-A3) Transport (A4) Construction - Installation (A5) Use (B1-B7) End of Life (C1-C4) Total
Use of renewable primary energy excluding renewable primary energy resources used as raw materials (MJ) 4.6E02 0.0E00 4.0E01 5.1E03 0.0E00 5.6E03
Use of renewable primary energy resources used as raw materials (MJ) 0.0E00 0.0E00 0.0E00 0.0E00 0.0E00 0.0E00
Total use of renewable primary energy resources (MJ) 4.6E02 0.0E00 4.0E01 5.1E03 0.0E00 5.6E03
Use of non-renewable primary energy excluding non-renewable primary energy resources used as raw materials (MJ) 1.3E04 2.7E02 3.8E03 1.1E05 0.0E00 1.3E05
Use of non-renewable primary energy resources used as raw materials (MJ) 9.3E03 0.0E00 0.0E00 0.0E00 0.0E00 9.3E03
Total use of non-renewable primary energy resources (MJ) 2.3E04 2.7E02 3.8E03 1.1E05 0.0E00 1.4E05
Use of secondary material (kg) 0.0E00 0.0E00 0.0E00 0.0E00 0.0E00 0.0E00
Use of renewable secondary fuels (MJ) 0.0E00 0.0E00 0.0E00 0.0E00 0.0E00 0.0E00
Net use of fresh water (m3) 1.1E03 0.0E00 2.8E02 1.1E00 0.0E00 1.3E03
Table 8 8 DR18 AWWA C900 PVC Pressure Pipe Use
of Resources
EPD Program Operator NSF International 789 N.
Dixboro Rd. Ann Arbor MI 48105 USA
www.nsfsustainability.org
12
Environmental Product Declaration
Resource (unit per 100 ft pipe for 100 yrs) Product Stage (A1-A3) Transport (A4) Construction - Installation (A5) Use (B1-B7) End of Life (C1-C4) Total
Use of renewable primary energy excluding renewable primary energy resources used as raw materials (MJ) 3.7E02 0.0E00 3.5E01 4.4E03 0.0E00 4.8E03
Use of renewable primary energy resources used as raw materials (MJ) 0.0E00 0.0E00 0.0E00 0.0E00 0.0E00 0.0E00
Total use of renewable primary energy resources (MJ) 3.7E02 0.0E00 3.5E01 4.4E03 0.0E00 4.8E03
Use of non-renewable primary energy excluding non-renewable primary energy resources used as raw materials (MJ) 7.8E03 2.0E02 3.7E03 9.6E04 0.0E00 1.1E05
Use of non-renewable primary energy resources used as raw materials (MJ) 7.7E03 0.0E00 0.0E00 0.0E00 0.0E00 7.7E03
Total use of non-renewable primary energy resources (MJ) 1.5E04 2.0E02 3.7E03 9.6E04 0.0E00 1.2E05
Use of secondary material (kg) 0.0E00 0.0E00 0.0E00 0.0E00 0.0E00 0.0E00
Use of renewable secondary fuels (MJ) 0.0E00 0.0E00 0.0E00 0.0E00 0.0E00 0.0E00
Net use of fresh water (m3) 1.6E03 0.0E00 2.5E02 9.8E-01 0.0E00 1.8E03
Table 9 8 DR25 AWWA C900 PVC Pressure Pipe Use
of Resources
EPD Program Operator NSF International 789 N.
Dixboro Rd. Ann Arbor MI 48105 USA
www.nsfsustainability.org
13
Environmental Product Declaration
Resource (unit per 100 ft pipe for 100 yrs) Product Stage (A1-A3) Transport (A4) Construction - Installation (A5) Use (B1-B7) End of Life (C1-C4) Total
Use of renewable primary energy excluding renewable primary energy resources used as raw materials (MJ) 2.6E03 0.0E00 3.7E01 1.3E04 0.0E00 1.5E04
Use of renewable primary energy resources used as raw materials (MJ) 0.0E00 0.0E00 0.0E00 0.0E00 0.0E00 0.0E00
Total use of renewable primary energy resources (MJ) 2.6E03 0.0E00 3.7E01 1.3E04 0.0E00 1.5E04
Use of non-renewable primary energy excluding non- renewable primary energy resources used as raw materials (MJ) 7.8E04 7.8E02 7.5E03 2.8E05 0.0E00 3.7E05
Use of non-renewable primary energy resources used as raw materials (MJ) 5.7E04 0.0E00 0.0E00 0.0E00 0.0E00 5.7E04
Total use of non-renewable primary energy resources (MJ) 1.4E05 7.8E02 7.5E03 2.8E05 0.0E00 4.2E05
Use of secondary material (kg) 0.0E00 0.0E00 0.0E00 0.0E00 0.0E00 0.0E00
Use of renewable secondary fuels (MJ) 0.0E00 0.0E00 0.0E00 0.0E00 0.0E00 0.0E00
Net use of fresh water (m3) 2.5E03 0.0E00 2.6E02 2.9E00 0.0E00 2.8E03
Table 10 24 DR25 AWWA C905 PVC Pressure Pipe
Resource Use
EPD Program Operator NSF International 789 N.
Dixboro Rd. Ann Arbor MI 48105 USA
www.nsfsustainability.org
14
Environmental Product Declaration
Resource (unit per 100 ft pipe for 100 yrs) Product Stage (A1-A3) Transport (A4) Construction - Installation (A5) Use (B1-B7) End of Life (C1-C4) Total
Use of renewable primary energy excluding renewable primary energy resources used as raw materials (MJ) 2.7E02 0.0E00 3.5E01 0.0E00 0.0E00 3.0E02
Use of renewable primary energy resources used as raw materials (MJ) 0.0E00 0.0E00 0.0E00 0.0E00 0.0E00 0.0E00
Total use of renewable primary energy resources (MJ) 2.7E02 0.0E00 3.5E01 0.0E00 0.0E00 3.0E02
Use of non-renewable primary energy excluding non- renewable primary energy resources used as raw materials (MJ) 3.4E03 8.7E01 3.7E03 0.0E00 0.0E00 7.2E03
Use of non-renewable primary energy resources used as raw materials (MJ) 2.3E03 0.0E00 0.0E00 0.0E00 0.0E00 2.3E03
Total use of non-renewable primary energy resources (MJ) 5.7E03 8.7E01 3.7E03 0.0E00 0.0E00 9.5E03
Use of secondary material (kg) 0.0E00 0.0E00 0.0E00 0.0E00 0.0E00 0.0E00
Use of renewable secondary fuels (MJ) 0.0E00 0.0E00 0.0E00 0.0E00 0.0E00 0.0E00
Net use of fresh water (m3) 1.2E04 0.0E00 2.2E02 0.0E00 0.0E00 1.2E04
Table 11 24 PS 46 ASTM F794/AASHTO M304
Profile-Wall Gravity Sewer PVC Pipe Resource Use
EPD Program Operator NSF International 789 N.
Dixboro Rd. Ann Arbor MI 48105 USA
www.nsfsustainability.org
15
Environmental Product Declaration
Resource (unit per 100 ft pipe for 100 yrs) Product Stage (A1-A3) Transport (A4) Construction - Installation (A5) Use (B1-B7) End of Life (C1-C4) Total
Use of renewable primary energy excluding renewable primary energy resources used as raw materials (MJ) 2.5E03 3.2E01 0.0E00 0.0E00 0.0E00 2.5E03
Use of renewable primary energy resources used as raw materials (MJ) 0.0E00 0.0E00 0.0E00 0.0E00 0.0E00 0.0E00
Total use of renewable primary energy resources (MJ) 2.5E03 0.0E00 3.2E01 0.0E00 0.0E00 2.5E03
Use of non-renewable primary energy excluding non- renewable primary energy resources used as raw materials (MJ) 4.7E04 2.8E02 7.4E03 0.0E00 0.0E00 5.5E04
Use of non-renewable primary energy resources used as raw materials (MJ) 1.2E02 0.0E00 0.0E00 0.0E00 0.0E00 1.2E02
Total use of non-renewable primary energy resources (MJ) 4.7E04 2.8E02 7.4E03 0.0E00 0.0E00 5.5E04
Use of secondary material (kg) 0.0E00 0.0E00 0.0E00 0.0E00 0.0E00 0.0E00
Use of renewable secondary fuels (MJ) 0.0E00 0.0E00 0.0E00 0.0E00 0.0E00 0.0E00
Net use of fresh water (m3) 1.4E03 0.0E00 2.5E02 0.0E00 0.0E00 1.6E03
Table 12 8 PS 46 ASTM F794 Profile-Wall PVC
Pipe Resource Use
EPD Program Operator NSF International 789 N.
Dixboro Rd. Ann Arbor MI 48105 USA
www.nsfsustainability.org
16
Environmental Product Declaration
Resource (unit per 100 ft pipe for 100 yrs) Product Stage (A1-A3) Transport (A4) Construction - Installation (A5) Use (B1-B7) End of Life (C1-C4) Total
Use of renewable primary energy excluding renewable primary energy resources used as raw materials (MJ) 2.4E02 3.5E01 0.0E00 0.0E00 0.0E00 2.8E02
Use of renewable primary energy resources used as raw materials (MJ) 0.0E00 0.0E00 0.0E00 0.0E00 0.0E00 0.0E00
Total use of renewable primary energy resources (MJ) 2.4E02 0.0E00 3.5E01 0.0E00 0.0E00 2.8E02
Use of non-renewable primary energy excluding non- renewable primary energy resources used as raw materials (MJ) 5.7E03 1.0E02 3.7E03 0.0E00 0.0E00 9.5E03
Use of non-renewable primary energy resources used as raw materials (MJ) 4.1E03 0.0E00 0.0E00 0.0E00 0.0E00 4.1E03
Total use of non-renewable primary energy resources (MJ) 9.8E03 1.0E02 3.7E03 0.0E00 0.0E00 1.4E04
Use of secondary material (kg) 0.0E00 0.0E00 0.0E00 0.0E00 0.0E00 0.0E00
Use of renewable secondary fuels (MJ) 0.0E00 0.0E00 0.0E00 0.0E00 0.0E00 0.0E00
Net use of fresh water (m3) 8.4E02 0.0E00 2.5E02 0.0E00 0.0E00 1.1E03
Table 13 8 DR35 PS46 ASTM D3034 Solid-Wall
Sanitary Sewer PVC Pipe Resource Use
EPD Program Operator NSF International 789 N.
Dixboro Rd. Ann Arbor MI 48105 USA
www.nsfsustainability.org
17
Environmental Product Declaration
Resource (unit per 100 ft pipe for 100 yrs) Product Stage (A1-A3) Transport (A4) Construction - Installation (A5) Use (B1-B7) End of Life (C1-C4) Total
Use of renewable primary energy excluding renewable primary energy resources used as raw materials (MJ) 2.1E03 0.0E00 3.5E01 0.0E00 0.0E00 2.1E03
Use of renewable primary energy resources used as raw materials (MJ) 0.0E00 0.0E00 0.0E00 0.0E00 0.0E00 0.0E00
Total use of renewable primary energy resources (MJ) 2.1E03 0.0E00 3.5E01 0.0E00 0.0E00 2.1E03
Use of non-renewable primary energy excluding non- renewable primary energy resources used as raw materials (MJ) 6.0E04 6.7E02 8.4E03 0.0E00 0.0E00 6.9E04
Use of non-renewable primary energy resources used as raw materials (MJ) 3.7E04 0.0E00 0.0E00 0.0E00 0.0E00 3.7E04
Total use of non-renewable primary energy resources (MJ) 9.7E04 6.7E02 8.4E03 0.0E00 0.0E00 1.1E05
Use of secondary material (kg) 0.0E00 0.0E00 0.0E00 0.0E00 0.0E00 0.0E00
Use of renewable secondary fuels (MJ) 0.0E00 0.0E00 0.0E00 0.0E00 0.0E00 0.0E00
Net use of fresh water (m3) 4.1E03 0.0E00 2.5E02 0.0E00 0.0E00 4.3E03
Table 14 24 PS 46 ASTM F679 Solid-Wall
Sanitary Sewer PVC Pipe Resource Use
EPD Program Operator NSF International 789 N.
Dixboro Rd. Ann Arbor MI 48105 USA
www.nsfsustainability.org
18
Environmental Product Declaration
Waste The following tables show the amount of
waste (hazardous, non-hazardous, and radioactive)
in each life cycle stage. Note that this waste
is from both foreground and background processes.
For example, there is no direct radioactive
waste from PVC pipe production it is from the
nuclear electricity production that feeds the
regional electric grid where PVC pipe is produced.
Waste (unit per 100 ft pipe for 100 yrs) Product Stage (A1-A3) Transport (A4) Construction - Installation (A5) Use (B1-B7) End of Life (C1-C4) Total
Hazardous waste (kg) 9.2E-02 0.0E00 2.2E-03 2.0E-03 0.0E00 9.6E-02
Non-hazardous waste (kg) 1.6E01 0.0E00 2.3E01 2.7E00 0.0E00 4.2E01
Radioactive waste (kg) 2.3E-03 0.0E00 2.2E-03 3.6E-03 0.0E00 8.1E-03
Table 15 Waste for 100 feet of Installed 8
DR18 AWWA C900 PVC Pressure Pipe
Waste (unit per 100 ft pipe for 100 yrs) Product Stage (A1-A3) Transport (A4) Construction - Installation (A5) Use (B1-B7) End of Life (C1-C4) Total
Hazardous waste (kg) 5.4E-02 0.0E00 2.1E-03 1.7E-03 0.0E00 5.8E-02
Non-hazardous waste (kg) 7.6E00 0.0E00 2.2E01 2.3E00 0.0E00 3.1E01
Radioactive waste (kg) 2.6E-03 0.0E00 2.0E-03 3.1E-03 0.0E00 7.7E-03
Table 16 Waste for 100 feet of Installed 8
DR25 AWWA C900 PVC Pressure Pipe
Waste (unit per 100 ft pipe for 100 yrs) Product Stage (A1-A3) Transport (A4) Construction - Installation (A5) Use (B1-B7) End of Life (C1-C4) Total
Hazardous waste (kg) 5.2E-01 0.0E00 2.0E-03 5.0E-03 0.0E00 5.3E-01
Non-hazardous waste (kg) 7.8E01 0.0E00 2.1E01 6.8E00 0.0E00 1.1E02
Radioactive waste (kg) 9.8E-03 0.0E00 2.0E-03 8.9E-03 0.0E00 2.1E-02
Table 17 Waste for 100 feet of Installed 24
DR25 AWWA C905 PVC Pressure Pipe
Waste (unit per 100 ft pipe for 100 yrs) Product Stage (A1-A3) Transport (A4) Construction - Installation (A5) Use (B1-B7) End of Life (C1-C4) Total
Hazardous waste (kg) 3.0E-01 0.0E00 1.9E-03 0.0E00 0.0E00 3.0E-01
Non-hazardous waste (kg) 5.2E01 0.0E00 2.0E01 0.0E00 0.0E00 7.1E01
Radioactive waste (kg) 1.9E-02 0.0E00 1.8E-03 0.0E00 0.0E00 2.1E-02
Table 18 Waste for 100 feet of Installed 24 PS
46 ASTM F794/AASHTO M304 Profile-Wall Gravity
Sewer PVC Pipe
EPD Program Operator NSF International 789 N.
Dixboro Rd. Ann Arbor MI 48105 USA
www.nsfsustainability.org
19
Environmental Product Declaration
Waste (unit per 100 ft pipe for 100 yrs) Product Stage (A1-A3) Transport (A4) Construction - Installation (A5) Use (B1-B7) End of Life (C1-C4) Total
Hazardous waste (kg) 3.8E-02 0.0E00 2.1E-03 0.0E00 0.0E00 4.0E-02
Non-hazardous waste (kg) 6.8E00 0.0E00 2.1E01 0.0E00 0.0E00 2.8E01
Radioactive waste (kg) 2.1E-03 0.0E00 2.0E-03 0.0E00 0.0E00 4.1E-03
Table 19 Waste for 100 feet of Installed 8 PS
46 ASTM F794 Profile-Wall PVC Pipe
Waste (unit per 100 ft pipe for 100 yrs) Product Stage (A1-A3) Transport (A4) Construction - Installation (A5) Use (B1-B7) End of Life (C1-C4) Total
Hazardous waste (kg) 4.0E-02 0.0E00 2.1E-03 0.0E00 0.0E00 4.2E-02
Non-hazardous waste (kg) 6.2E00 0.0E00 2.1E01 0.0E00 0.0E00 2.8E01
Radioactive waste (kg) 1.5E-03 0.0E00 2.0E-03 0.0E00 0.0E00 3.5E-03
Table 20 Waste for 100 feet of Installed 8
DR35 PS46 ASTM D3034 Solid-Wall Sanitary Sewer
PVC Pipe
Waste (unit per 100 ft pipe for 100 yrs) Product Stage (A1-A3) Transport (A4) Construction - Installation (A5) Use (B1-B7) End of Life (C1-C4) Total
Hazardous waste (kg) 3.6E-01 0.0E00 2.5E-03 0.0E00 0.0E00 3.6E-01
Non-hazardous waste (kg) 5.6E01 0.0E00 2.0E01 0.0E00 0.0E00 7.6E01
Radioactive waste (kg) 9.6E-03 0.0E00 2.0E-03 0.0E00 0.0E00 1.2E-02
Table 21 Waste for 100 feet of Installed 24 PS
46 ASTM F679 Solid-Wall Sanitary Sewer PVC Pipe
EPD Program Operator NSF International 789 N.
Dixboro Rd. Ann Arbor MI 48105 USA
www.nsfsustainability.org
20
Environmental Product Declaration
Life Cycle Impact Assessment The impact
categories analyzed for this EPD include global
warming potential, ozone depletion,
acidification, eutrophication and smog formation.
The TRACI 2 version 4.0 impact assessment
methodology was used to calculate the
environmental impacts in this LCA. Pressure Pipe
(unit per 100 ft pipe for 100 yrs) Product Stage (A1-A3) Transport (A4) Construction - Installation (A5) Use (B1-B7) End of Life (C1-C4) Total
Ozone Depletion (kg CFC-11 eq) 5.6E-05 7.5E-10 5.4E-06 5.4E-06 0.0E00 6.2E-05
Global Warming Potential (kg CO2 eq) 1.1E03 2.0E01 2.5E02 2.5E02 0.0E00 1.4E03
Smog (kg O3 eq) 5.2E01 3.2E00 8.5E01 8.5E01 0.0E00 1.4E02
Acidification (mol H eq) 2.8E02 6.6E00 1.7E02 1.7E02 0.0E00 4.5E02
Eutrophication (kg N eq) 3.7E-01 6.6E-03 3.9E-01 3.9E-01 0.0E00 7.7E-01
Table 22 8 DR18 AWWA C900 PVC Pressure Pipe
environmental impacts using the TRACI impact
methodology
Impact Category (unit per 100 ft pipe for 100 yrs) Product Stage (A1-A3) Transport (A4) Construction - Installation (A5) Use (B1-B7) End of Life (C1-C4) Total
Ozone Depletion (kg CFC-11 eq) 4.1E-05 5.7E-10 5.2E-06 1.3E-07 0.0E00 4.6E-05
Global Warming Potential (kg CO2 eq) 7.4E02 1.5E01 2.5E02 8.2E03 0.0E00 9.2E03
Smog (kg O3 eq) 3.2E01 2.4E00 8.5E01 5.0E02 0.0E00 6.2E02
Acidification (mol H eq) 1.6E02 5.0E00 1.7E02 3.7E03 0.0E00 4.0E03
Eutrophication (kg N eq) 2.2E-01 5.0E-03 3.8E-01 9.7E-01 0.0E00 1.6E00
Table 23 8 DR25 AWWA C900 PVC Pressure Pipe
environmental impacts using the TRACI impact
methodology
Impact Category (unit per 100 ft pipe for 100 yrs) Product Stage (A1-A3) Transport (A4) Construction - Installation (A5) Use (B1-B7) End of Life (C1-C4) Total
Ozone Depletion (kg CFC-11 eq) 3.5E-04 2.2E-09 5.0E-06 4.4E-06 0.0E00 3.6E-04
Global Warming Potential (kg CO2 eq) 6.7E03 5.7E01 5.1E02 2.7E05 0.0E00 2.8E05
Smog (kg O3 eq) 3.1E02 9.3E00 2.0E02 1.6E04 0.0E00 1.7E04
Acidification (mol H eq) 1.6E03 1.9E01 3.7E02 1.2E05 0.0E00 1.2E05
Eutrophication (kg N eq) 2.1E00 1.9E-02 5.9E-01 3.2E01 0.0E00 3.4E01
Table 24 24 DR25 AWWA C905 PVC Pressure Pipe
environmental impacts using the TRACI impact
methodology
EPD Program Operator NSF International 789 N.
Dixboro Rd. Ann Arbor MI 48105 USA
www.nsfsustainability.org
21
Environmental Product Declaration
Gravity Sewer Pipe
Impact Category (unit per 100 ft pipe for 100 yrs) Product Stage (A1-A3) Transport (A4) Construction - Installation (A5) Use (B1-B7) End of Life (C1-C4) Total
Ozone Depletion (kg CFC-11 eq) 1.2E-04 7.8E-10 4.7E-06 0.0E00 0.0E00 1.3E-04
Global Warming Potential (kg CO2 eq) 2.3E03 2.1E01 5.0E02 0.0E00 0.0E00 2.9E03
Smog (kg O3 eq) 1.3E02 3.4E00 2.0E02 0.0E00 0.0E00 3.3E02
Acidification (mol H eq) 5.6E02 6.8E00 3.7E02 0.0E00 0.0E00 9.3E02
Eutrophication (kg N eq) 1.5E00 6.8E-03 5.7E-01 0.0E00 0.0E00 2.1E00
Table 25 24 PS 46 ASTM F794/AASHTO M304
Profile-Wall Gravity Sewer PVC Pipe
environmental impacts using the TRACI impact
methodology
Impact Category (unit per 100 ft pipe for 100 yrs) Product Stage (A1-A3) Transport (A4) Construction - Installation (A5) Use (B1-B7) End of Life (C1-C4) Total
Ozone Depletion (kg CFC-11 eq) 1.5E-05 2.4E-10 5.2E-06 0.0E00 0.0E00 2.0E-05
Global Warming Potential (kg CO2 eq) 2.7E02 6.4E00 2.5E02 0.0E00 0.0E00 5.3E02
Smog (kg O3 eq) 1.3E01 1.0E00 8.5E01 0.0E00 0.0E00 9.9E01
Acidification (mol H eq) 6.0E01 2.1E00 1.7E02 0.0E00 0.0E00 2.3E02
Eutrophication (kg N eq) 1.5E-01 2.1E-03 3.8E-01 0.0E00 0.0E00 5.3E-01
Table 26 8 PS 46 ASTM F794 Profile-Wall PVC
Pipe environmental impacts using the TRACI
impact methodology
Impact Category (unit per 100 ft pipe for 100 yrs) Product Stage (A1-A3) Transport (A4) Construction - Installation (A5) Use (B1-B7) End of Life (C1-C4) Total
Ozone Depletion (kg CFC-11 eq) 2.4E-05 2.9E-10 5.2E-06 0.0E00 0.0E00 2.9E-05
Global Warming Potential (kg CO2 eq) 4.8E02 7.5E00 2.5E02 0.0E00 0.0E00 7.4E02
Smog (kg O3 eq) 2.2E01 1.2E00 8.5E01 0.0E00 0.0E00 1.1E02
Acidification (mol H eq) 1.2E02 2.5E00 1.7E02 0.0E00 0.0E00 2.8E02
Eutrophication (kg N eq) 1.6E-01 2.5E-03 3.8E-01 0.0E00 0.0E00 5.4E-01
Table 27 8 DR35 PS46 ASTM D3034 Solid-Wall
Sanitary Sewer PVC Pipe environmental impacts
using the TRACI impact methodology
EPD Program Operator NSF International 789 N.
Dixboro Rd. Ann Arbor MI 48105 USA
www.nsfsustainability.org
22
Environmental Product Declaration
Impact Category (unit per 100 ft pipe for 100 yrs) Product Stage (A1-A3) Transport (A4) Construction - Installation (A5) Use (B1-B7) End of Life (C1-C4) Total
Ozone Depletion (kg CFC-11 eq) 2.4E-04 1.9E-09 1.5E-05 0.0E00 0.0E00 2.6E-04
Global Warming Potential (kg CO2 eq) 4.8E03 4.9E01 5.6E02 0.0E00 0.0E00 5.4E03
Smog (kg O3 eq) 2.2E02 8.0E00 2.2E02 0.0E00 0.0E00 4.5E02
Acidification (mol H eq) 1.1E03 1.6E01 4.0E02 0.0E00 0.0E00 1.6E03
Eutrophication (kg N eq) 1.5E00 1.6E-02 6.5E-01 0.0E00 0.0E00 2.2E00
Table 28 24 PS 46 ASTM F679 Solid-Wall Sanitary
Sewer PVC Pipe environmental impacts using the
TRACI impact methodology Life Cycle Impact
Conclusions PVC pipe is designed to minimize
environmental impacts. Its smooth interior
surface minimizes energy consumption for pumping
due to reduced frictional forces. Its corrosion
resistance enables long-term durability. Studies
confirm PVC pipes longevity to be in excess of
100 years, which means that it has to be
replaced less often, resulting in additional
environmental impact reductions. Based on the
results from the life cycle assessment, the use
phase is the primary driver of environmental
impacts for PVC pipe in pressurized water
applications. For non-pressure PVC pipes (and
for pressure pipes excluding the use phase), the
life cycle impacts are strongly driven by the PVC
resin and the installation process. Additional
Environmental Information The following
statements are required by the referenced product
category rule. PVC pipe and fittings are
resistant to chemicals generally found in water
and sewer systems, preventing any leaching or
releases to ground and surface water during the
use of the piping system. No known chemicals are
released internally into the water system. No
known toxicity effects occur in the use of the
product. LCA Development This EPD and
corresponding LCA were prepared by Sustainable
Solutions Corporation of Royersford,
Pennsylvania.
EPD Program Operator NSF International 789 N.
Dixboro Rd. Ann Arbor MI 48105 USA
www.nsfsustainability.org
23
Environmental Product Declaration
- Comparability
- This EPD meets the requirements for comparability
with products evaluated in accordance to the
guiding PCR document. EPDs from different
programs may not be comparable. - References
- AASHTO M304 Standard Specification for Poly(Vinyl
Chloride) (PVC) Profile Wall Drain Pipe and
Fittings Based on Controlled Inside Diameter.
2011 - ASTM D1784 Specification for Rigid Polyvinyl
Chloride (PVC) Compounds and Chlorinated
Polyvinyl Chloride (CPVC) Compounds. 2011. - ASTM D2837 Test Method for Obtaining Hydrostatic
Design Basis for Thermoplastic Pipe Materials or
Pressure Design Basis for Thermoplastic Pipe
Products. 2013e1. - ASTM D3034 Standard Specification for Type PSM
Poly(Vinyl Chloride) (PVC) Sewer Pipe and
Fittings. 2014 - ASTM F477 Specification for Elastomeric Seals
(Gaskets) for Joining Plastic Pipe. 2014. - ASTM F679 Standard Specification for Poly(Vinyl
Chloride) (PVC) Large Diameter Plastic Gravity
Sewer Pipe and Fittings. 2013 - ASTM F794 Standard Specification for Poly(Vinyl
Chloride) (PVC) Profile Gravity Sewer Pipe and
Fittings Based on Controlled Inside Diameter.
2014 - AWWA C900 Standard for Polyvinyl Chloride (PVC)
Pressure Pipe and Fabricated Fittings, 4 in.
through 12 in., For Water Transmission and
Distribution. 2007. - AWWA C905 Standard for Polyvinyl Chloride (PVC)
Pressure Pipe and Fabricated Fittings, 14 in.
through 48 in., For Water Transmission and
Distribution. 2010. - Burn, S. et. al., Long-term Performance
Prediction for PVC Pipes, AWWARF Report 91092F,
May 2006. - Folkman, Steven. PVC Pipe Longevity Report
Affordability the 100 Year Benchmark
Standard. Utah State University Buried Structures
Laboratory. May 2014. - Forum on Forestry Forum. http//www.forestryforum.
com/board/index.php?topic14063.0. Accessed
March 2013. - Forum on Heavy Equipment. http//www.heavyequipmen
tforums.com/showthread.php?5804-
Fuel-Consumption Accessed March 2013.
EPD Program Operator NSF International 789 N.
Dixboro Rd. Ann Arbor MI 48105 USA
www.nsfsustainability.org
24
Environmental Product Declaration
- SI Metric. Density of Dry Material Table.
http//www.simetric.co.uk/si_materials.htm
Accessed September 25, 2013. - SimaPro v7.3.3 Multi user. PRé Consultants. 2011
- UL 1285 Pipe and Couplings, Polyvinyl Chloride
(PVC), and Oriented Polyvinyl Chloride (PVCO)
for Underground Fire Service. 2008. - US LCI LCI Database for Life Cycle Engineering,
National Renewable Energy Laboratory, Lakewood,
CO, 2008
EPD Program Operator NSF International 789 N.
Dixboro Rd. Ann Arbor MI 48105 USA
www.nsfsustainability.org
Recommended
CrystalGraphics Presentations


