
How to Use Ichimoku Charts in Forex Trading - PowerPoint PPT Presentation
Title:
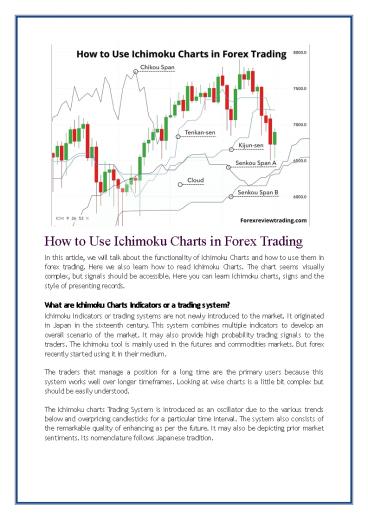
How to Use Ichimoku Charts in Forex Trading
Description:
In this article, we will talk about the functionality of Ichimoku Charts and how to use them in forex trading. Here we also learn how to read Ichimoku Charts. The chart seems visually complex, but signals should be accessible. Here you can learn Ichimoku charts, signs and the style of presenting records. – PowerPoint PPT presentation
Number of Views:102
Title: How to Use Ichimoku Charts in Forex Trading
1
How to Use Ichimoku Charts in Forex Trading In
this article, we will talk about the
functionality of Ichimoku Charts and how to use
them in forex trading. Here we also learn how to
read Ichimoku Charts. The chart seems visually
complex, but signals should be accessible. Here
you can learn Ichimoku charts, signs and the
style of presenting records. What are Ichimoku
Charts Indicators or a trading system? Ichimoku
Indicators or trading systems are not newly
introduced to the market. It originated in Japan
in the sixteenth century. This system combines
multiple indicators to develop an overall
scenario of the market. It may also provide high
probability trading signals to the traders. The
Ichimoku tool is mainly used in the futures and
commodities markets. But forex recently started
using it in their medium. The traders that
manage a position for a long time are the primary
users because this system works well over longer
timeframes. Looking at wise charts is a little
bit complex but should be easily
understood. The Ichimoku charts Trading System
is introduced as an oscillator due to the various
trends below and overpricing candlesticks for a
particular time interval. The system also
consists of the remarkable quality of enhancing
as per the future. It may also be depicting prior
market sentiments. Its nomenclature follows
Japanese tradition.
2
- But the Cloud consists of different features and
three other line indicators that help signal
effective trading setup and patterns. Traders can
eliminate market noise through longer timeframes
and raise the results of the Ichimoku Indicators
technical support tool. - Traders will get Ichimoku indicators in
MetaTrader 4 trading software. Here we provided
you with details about the main components of
Ichimoku indicators. - Kumo Cloud (the gridded area) These sectors
represent resistance and support, distracted
from preceding costs data. The vertex of an Up
Cloud is Senkou Spans A and B. Main vigilantism
happens when candlesticks exit the cloud.
Multiple lines come in or pass via the
particular regions during the Cloud changes
colour. - Chinkou-span (wrinkled green signal) This line
determines market attitude based on current
closing prices but flows backwards mainly 26-time
intervals. Its location connected to costing
data indicates if buyer and seller influence the
action, stretching the Clouds section should
stand out resistance if it is going inside the
picture. - Tenkan-sen (red line) and Kijun-sen (blue line)
These rays are similar to flowing averages and
will be determined from past lows and high nearly
9 and 26 periods, approximately. The Tenkan-sen
or The Green line is the fastest of the two,
and its criss-cross is the primary trading
alert, intervals its slope shift to determine the
markets momentum. - Senoku span A (green interrupted edges of the
Cloud) This creates one of the edges of the
Koumo Cloud. It is the quickest moving line
signal. See here crossing above the others Trend
the Cloud on its crush point. It is determined in
the form of some duels, and after that, it
plotted 26 periods in advance. - Senkou span B (red cut in edges of the Cloud) It
is the lowest edge of the Cloud, and it is
determined by the average of the low/high of the
past 562 candlesticks. It is also designed 26
periods in advance, which is the reason behind
cloud stretch more than the final cost
candlestick. - The Kumo cloud is utilised in multiple ways to
create and develop trading strategies to gain
remarkable profits. The section shows resistance
and support when the breadth and width state to
strength and volatility. When prices are higher
from the Cloud, that is known as a bullish
situation and under a bearish situation. - Imminent changes in direction should be shown by
the flips and Twists of the Cloud. Investors
should be counselled to stop when the
candlesticks are present in the clouds Senko
boundaries and Spans. - This system will offer one look, as its name
suggested for the investors to explain. Depend
only on one indicator to create a macro view,
better than preferring four inbuilt indicators
to see the inter function of strict market
variables. The Ichimoku Charts indicator is
utilised to determine time frame momentum
compared to the projected area of resistance and
support. - How to read an Ichimoku Charts?
- The Ichimoku trading system has the cloud and
three more line indicators. Stable investors are
the primary users of these charts because wider
timeframes work efficiently with Ichimoku
trading tools. It will provide daily and weekly
records that may also earn support.
3
The cloud shows a section of resistance and
support. And the linework is similar to the
MACD signals. The main factors of reference are
during the multiple components exchange. There is
a quality of the information provided, but a
sophisticated trader waits till costing
candlesticks without crack from the cloud and
other signals. The Green signal consists of a
g setting that permits it to show recent
closing prices step backwards 26 intervals,
thereby comparing the complete shift along with
the contemporary movement in price. The Cloud
performs similarly with the filter, and while
price cracks via these areas, along with the
series, move below and above, in this case, the
breakout situation exists. Again, an intelligent
trader should mainly look for further
confirmation to bias the negatives into his
sides. As we are telling in our all article,
technical indicators, either Ichimoku charts or
other, will never show 100 correct result.
Wrong signals can occur, but a number of positive
signals are somehow enough to provide forex
trading with an edge. The ability to explain and
to understand Ichimoku signs should be generated
at a particular time. It may also get
complementing this tool with another indicator
that is necessary for more potential and confirm
shift change.
Recommended
CrystalGraphics Presentations


