
http://egee.cesnet.cz/ - PowerPoint PPT Presentation
1 / 1
Title:
http://egee.cesnet.cz/
Description:
This VOCE Resources Testing covers 16 CEs listed in the table above. ... Here we show results for 3 time values, T1=10 mins, T2=1 hr and T3=6 hrs. ... – PowerPoint PPT presentation
Number of Views:21
Avg rating:3.0/5.0
Title: http://egee.cesnet.cz/
1
VO VOCE - Availability and Stability of Resources
Enabling Grids for E-sciencE
VO VOCE - Availability and Stability of Resources
Jirí Chudoba, Jaroslava Schovancová,
CESNET and Institute of Physics, Academy of
Sciences, Czech Republic
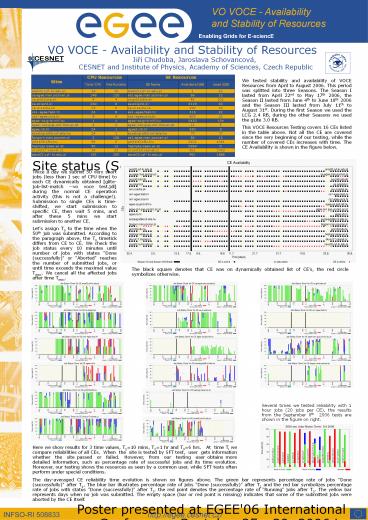
We tested stability and availability of VOCE
Resources from April to August 2006. This period
was splitted into three Seasons. The Season I
lasted from April 22nd to May 17th 2006, the
Season II lasted from June 4th to June 18th 2006
and the Season III lasted from July 11th to
August 31st. During the first Season we used the
LCG 2.4 RB, during the other Seasons we used the
gLite 3.0 RB. This VOCE Resources Testing covers
16 CEs listed in the table above. Not all the CE
are covered since the very beginning of our
testing, while the number of covered CEs
increases with time. The CE Availability is shown
in the figure below.
Site status (September 8th, 2006).
Twice a day we submit 50 very short jobs (less
than 1 sec of CPU time) to each CE dynamically
obtained glite-job-list-match --vo voce
test.jdl during the normal CE operation activity
(this is not a challenge!). Submission to single
CEs is time-shifted, we start submission to
specific CE, then wait 5 mins, and after these 5
mins we start submission to another CE. Let's
assign T0 to the time when the 50th job was
submitted. According to the paragraph above, the
T0 timetick differs from CE to CE. We check the
job status every 10 minutes until number of jobs
with states "Done (successfully)" or "Aborted"
reaches the number of submitted jobs, or until
time exceeds the maximal value Tmax. We cancel
all the affected jobs after time Tmax.
The black square denotes that CE was on
dynamically obtained list of CEs, the red circle
symbolizes otherwise.
Several times we tested reliability with 1 hour
jobs (20 jobs per CE), the results from the
September 8th 2006 tests are shown in the figure
on right.
Here we show results for 3 time values, T110
mins, T21 hr and T36 hrs. At time Ti we
compare reliabilities of all CEs. When the
site is tested by SFT test, user gets
information whether the site passed or
failed. However, from our testing user
obtains more detailed information, such as
percentage rate of successful jobs and its time
evolution. Moreover, our testing shows the
resources as seen by a common user, while SFT
tests often perform under special conditions.
The day-averaged CE reliability time evolution is
shown on figures above. The green bar represents
percentage rate of jobs "Done (successfully)"
after T1, The blue bar illustrates percentage
rate of jobs "Done (successfully)" after T2 and
the red bar symbolizes percentage rate of jobs
with status "Done (successfully)" after T3. the
red point denotes the percentage rate of
"Running" jobs after T3. The yellow bar
represents days when no job was submitted. The
empty space (bar or red point is missing)
indicates that some of the submitted jobs were
aborted by the CE itself.
Poster presented at EGEE'06 International
Conference, Septeber 25 - 29, 2006 in Geneva,
Switzerland.
http//egee.cesnet.cz/
Recommended
CrystalGraphics Presentations


