
SAFE AND THRIVING FOREVER FAMILIES SOONER - PowerPoint PPT Presentation
Title:
SAFE AND THRIVING FOREVER FAMILIES SOONER
Description:
SAFE AND THRIVING FOREVER FAMILIES SOONER. Division of Family & Children Services ... How many of these children can be safely reunited? ... – PowerPoint PPT presentation
Number of Views:26
Avg rating:3.0/5.0
Title: SAFE AND THRIVING FOREVER FAMILIES SOONER
1
SAFE AND THRIVING FOREVER FAMILIES SOONER
- Division of Family Children Services
- G-Force Meeting
- June 25, 2009
2
AGENDA
- Child Protective Services Focus on Risk
Assessments - Field Operations Review Guide Training
- Permanency Focus on Composites
- Quality Assurance Process
- OFI Information
3
(No Transcript)
4
RECURRENCE OF MALTREATMENTMay 2008 May 2009
National Standard 5.4 or less
Definition Of all children who were victims of
substantiated maltreatment, what percent had a
substantiated report of maltreatment within the
past 6 months?
5
State 3.07
6
(No Transcript)
7
DISPOSITION OF SUBSTANTIATED INVESTIGATIONSJune
2008 April 2009
While the percentage of substantiated
investigations opened for family preservation has
declined, there has been an increase in the
percentage that are closed during this time
period.
8
OVERALL LEVEL OF RISK
9
LEVEL OF RISK FOR FAMILY PRESERVATION
PERMANENCY CASESJuly 18, 2008 June 18, 2009
10
LEVEL OF RISK FOR FAMILY PRESERVATION
PERMANENCY CASES BY PERCENTAGEJuly 18, 2008
June 18, 2009
- 51 if cases opened for family preservation
during this period had a risk level of somewhat
and 42.3 were rated as considerable. - 74.7 of cases opened for placement had risk
levels of considerable or extreme.
lt1
Note There were 7,268 family preservation cases
and 2,013 permanency cases with risk levels
during this time period.
11
PERCENTAGE OF VERY LITTLE RISK CASES BY REGION
State - Fam. Preserv. 4.2
State - Permanency3.8
Regional percentages ranged from 1.5 to 18.1
for family preservation and 0 to 18.7 for
permanency cases.
12
PERCENTAGE OF CASES WITH SOMEWHAT AS RISK LEVEL
BY REGION
State Fam. Preserv. 51.0
State - Permanency 21.0
Regional percentages ranged from 58.6 to 65.7
for family preservation and 9.7 to 36.4 for
permanency cases.
13
PERCENTAGE OF CONSIDERABLE RISK CASES BY REGION
State Permanency53.2
State -Fam. Preserv. 42.3
Regional percentages ranged from 14.8 to 56.6
for family preservation and 40.9 to 71.8 for
permanency cases.
14
PERCENTAGE OF CASES RATED AS EXTREME BY REGION
State Permanency 21.5
State Fam. Preserv. 2.3
Regional percentages ranged from none to 4.3 for
family preservation and none to 39.8 for
permanency cases. Region 17 had no cases rated
as extreme.
15
REGION 1 LEVEL OF RISK FOR FAMILY PRESERVATION
PERMANENCY CASES BY PERCENTAGE
Information reflects risk assessment levels for
573 Family Preservation cases and 108 Permanency
cases.
16
REGION 2 LEVEL OF RISK FOR FAMILY PRESERVATION
PERMANENCY CASES BY PERCENTAGE
Information reflects risk assessment levels for
479 Family Preservation cases and 114 Permanency
cases.
17
REGION 3 LEVEL OF RISK FOR FAMILY PRESERVATION
PERMANENCY CASES BY PERCENTAGE
Information reflects risk assessment levels for
553 Family Preservation cases and 126 Permanency
cases.
18
REGION 4 LEVEL OF RISK FOR FAMILY PRESERVATION
PERMANENCY CASES BY PERCENTAGE
Information reflects risk assessment levels for
472 Family Preservation cases and 135 Permanency
cases.
19
REGION 5 LEVEL OF RISK FOR FAMILY PRESERVATION
PERMANENCY CASES BY PERCENTAGE
Information reflects risk assessment levels for
485 Family Preservation cases and 73 Permanency
cases.
20
REGION 6 LEVEL OF RISK FOR FAMILY PRESERVATION
PERMANENCY CASES BY PERCENTAGE
Information reflects risk assessment levels for
712 Family Preservation cases and 99 Permanency
cases.
21
REGION 7 LEVEL OF RISK FOR FAMILY PRESERVATION
PERMANENCY CASES BY PERCENTAGE
Information reflects risk assessment levels for
338 Family Preservation cases and 63 Permanency
cases.
22
REGION 8 LEVEL OF RISK FOR FAMILY PRESERVATION
PERMANENCY CASES BY PERCENTAGE
Information reflects risk assessment levels for
322 Family Preservation cases and 82 Permanency
cases.
23
REGION 9 LEVEL OF RISK FOR FAMILY PRESERVATION
PERMANENCY CASES BY PERCENTAGE
Information reflects risk assessment levels for
298 Family Preservation cases and 42 Permanency
cases.
24
REGION 10 LEVEL OF RISK FOR FAMILY PRESERVATION
PERMANENCY CASES BY PERCENTAGE
Information reflects risk assessment levels for
483 Family Preservation cases and 52 Permanency
cases.
25
REGION 11 LEVEL OF RISK FOR FAMILY PRESERVATION
PERMANENCY CASES BY PERCENTAGE
Information reflects risk assessment levels for
618 Family Preservation cases and 47 Permanency
cases.
26
REGION 12 LEVEL OF RISK FOR FAMILY PRESERVATION
PERMANENCY CASES BY PERCENTAGE
Information reflects risk assessment levels for
322 Family Preservation cases and 162 Permanency
cases.
27
REGION 13 LEVEL OF RISK FOR FAMILY PRESERVATION
PERMANENCY CASES BY PERCENTAGE
Information reflects risk assessment levels for
506 Family Preservation cases and 213 Permanency
cases.
28
REGION 14 LEVEL OF RISK FOR FAMILY PRESERVATION
PERMANENCY CASES BY PERCENTAGE
Information reflects risk assessment levels for
210 Family Preservation cases and 193 Permanency
cases.
29
REGION 15 LEVEL OF RISK FOR FAMILY PRESERVATION
PERMANENCY CASES BY PERCENTAGE
Information reflects risk assessment levels for
166 Family Preservation cases and 135 Permanency
cases.
30
REGION 16 LEVEL OF RISK FOR FAMILY PRESERVATION
PERMANENCY CASES BY PERCENTAGE
Information reflects risk assessment levels for
321 Family Preservation cases and 108 Permanency
cases.
lt1
31
REGION 17 LEVEL OF RISK FOR FAMILY PRESERVATION
PERMANENCY CASES BY PERCENTAGE
Information reflects risk assessment levels for
394 Family Preservation cases and 188 Permanency
cases.
lt1
32
(No Transcript)
33
(No Transcript)
34
(No Transcript)
35
(No Transcript)
36
(No Transcript)
37
(No Transcript)
38
(No Transcript)
39
(No Transcript)
40
(No Transcript)
41
(No Transcript)
42
(No Transcript)
43
(No Transcript)
44
(No Transcript)
45
(No Transcript)
46
(No Transcript)
47
(No Transcript)
48
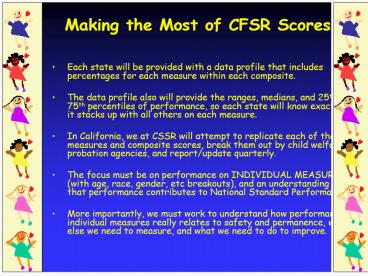
MAKING THE MOST OUT OF PERFORMANCE COMPOSITES
- We have the data profiles regarding Georgias
overall performance and the percentages for each
measure (including county level data). - The data profiles provide the ranges, medians,
and 25th and 75th profiles of performance so that
we know how we compare to other states on these
measures. - We will focus on how performance for each
individual measure impact or contribute to
overall performance. - Most importantly, we will stress how performance
on each individual measure really relate to
safety and permanency and what we need to do so
that children in Georgia will have safe and
thriving forever families sooner.
49
PERMANENCY COMPOSITE 1
Measure C1 - 1 Exits to reunification in less than 12 months Of all children discharged from foster care to reunification in the year shown, who had been in foster care for 8 days or longer, what percent was reunified in less than 12 months from the date of the latest removal from home? (Includes trial home visit adjustment) national median 69.9, 75th percentile 75.2
Measure C1 - 2 Exits to reunification, median stay Of all children discharged from foster care (FC) to reunification in the year shown, who had been in FC for 8 days or longer, what was the median length of stay (in months) from the date of the latest removal from home until the date of discharge to reunification? (This includes trial home visit adjustment) national median 6.5 months, 25th Percentile 5.4 months (lower score is preferable in this measure)
50
Permanency Composite 1 Timeliness and
Permanency of Reunification
National Standard or Median Period Ending 3/31/2008 Period Ending 3/31/2009
Timeliness Permanency of Reunification National Standard 122.6 or higher 116.2 117.7
National Ranking 19 of 47 19 of 47
C1-1. Exits to Reunification in less than 12 Months National Median 69.9 (75th Percentile 75.2) 61.3 57.5
C1-2. Exits to Reunification, Median Stays National Median 6.5 months (25th Percentile 5.4 months) 10.1 10.8
51
CHILDREN WHO ENTERED CARE FROM OCTOBER DECEMBER
2008 WITH GOAL OF REUNIFICATION (6/25/2009)
Number Percentage
DFCS Foster Home 340 47.4
Relative-Paid 109 15.2
CPA Foster Home 85 11.9
CCI 54 7.5
Relative-Unpaid 43 6.0
Group Home 29 4.0
Parent 14 2.0
Not Listed 12 1.7
Other Person/Resource 10 1.4
Hospital 9 1.3
YDC/RYDC 6 1.0
Runaway 3 0.0
ICPC Foster Home 2 0.0
Emergency Shelter 1 0.0
Total 717
52
CHILDREN WHO ENTERED CARE FROM OCTOBER DECEMBER
2008 WITH GOAL OF REUNIFICATION (6/25/2009) BY
REGION
53
QUESTIONS FOR DISCUSSION
- How many of these children can be safely
reunited? - What additional work must be done, for example
with court processes? - What supports must be in place for these children
to be safe and thriving with their forever
families? - What risk issues are you managing?
54
Re-entries to Foster Care in Less than 12 Months
National Median Period Ending 3/31/2008 Period Ending 3/31/2009
C1-4 Re-entries to foster care in less than 12 months. 15.0 (25th percentile 9.9) 8.7 6.1
Of all children discharged from foster care to reunification in the 12-month period prior to the year shown, what percent re-entered foster care in less than 12 months from the date of discharge? national median 15.0, 25th Percentile 9.9
55
FOSTER CARE RE-ENTRY RATEMay 2008 May 2009
National standard less than or equal to 8.60
Of the children who entered care in May 2009,
5.71 had exited care less than 12 months ago.
56
PERMANENCY COMPOSITE 2
Measure C2 - 1 Exits to adoption in less than 24 months Of all children who were discharged from foster care to a finalized adoption in the year shown, what percent was discharged in less than 24 months from the date of the latest removal from home? national median 26.8, 75th Percentile 36.6
Measure C2 - 2 Exits to adoption, median length of stay Of all children who were discharged from foster care (FC) to a finalized adoption in the year shown, what was the median length of stay in FC (in months) from the date of latest removal from home to the date of discharge to adoption? national median 32.4 months, 25th Percentile 27.3 months (lower score is preferable in this measure)
57
Permanency Composite 2 Timeliness of Adoptions
National Standard or Median Period Ending 3/31/2008 Period Ending 3/31/2009
Timeliness of Adoptions National Standard 106.4 or higher 105.2 99.3
National Ranking 14 of 47 21 of 47
C2 - 1 Exits to adoption in less than 24 months National Median 26.8 (75th percentile 36.6) 22.4 26.9
Measure C2 - 2 Exits to adoption, median length of stay National Median 32.4 months (25th percentile 27.3 months) 33.4 33.2
58
Progress Toward Adoption for Children in Foster
Care for 17 Months or Longer
Measure C2 - 3 Children in care 17 months, adopted by the end of the year Of all children in foster care (FC) on the first day of the year shown who were in FC for 17 continuous months or longer (and who, by the last day of the year shown, were not discharged from FC with a discharge reason of live with relative, reunify, or guardianship), what percent was discharged from FC to a finalized adoption by the last day of the year shown? national median 20.2, 75th Percentile 22.7
Measure C2 - 4 Children in care 17 months achieving legal freedom within 6 months Of all children in foster care (FC) on the first day of the year shown who were in FC for 17 continuous months or longer, and were not legally free for adoption prior to that day, what percent became legally free for adoption during the first 6 months of the year shown? Legally free means that there was a parental rights termination date reported to AFCARS for both mother and father. This calculation excludes children who, by the end of the first 6 months of the year shown had discharged from FC to "reunification," "live with relative," or "guardianship." national median 8.8, 75th Percentile 10.9
59
Progress Toward Adoption for Children in Foster
Care for 17 Months or Longer
National Standard or Median Period Ending 3/31/2008 Period Ending 3/31/2009
C2 - 3 Children in care 17 months, adopted by the end of the year National Median 20.2 (75th percentile 22.7) 22.2 26.0
C2 - 4 Children in care 17 months achieving legal freedom within 6 months 8.8 (75th percentile 10.9) 14.8 7.8
60
Progress Toward Adoption of Children Who Are
Legally Free for Adoption
National Median Period Ending 3/31/2008 Period Ending 3/31/2009
Legally free children adopted in less than 12 months 45.8 (75th percentile 53.7) 50.3 51.0
Of all children who became legally free for adoption in the 12 month period prior to the year shown (i.e., there was a parental rights termination date reported to AFCARS for both mother and father), what percent was discharged from foster care to a finalized adoption in less than 12 months of becoming legally free? national median 45.8, 75th Percentile 53.7
61
NUMBER PERCENT OF CHILDREN LEGALLY FREE FOR
ADOPTION BY REGIONAS OF JUNE 19, 2009N-1,245
62
PLACEMENT SETTING FOR CHILDREN WHO ARE LEGALLY
FREE FOR ADOPTION
63
PERMANENCY PLAN FOR CHILDREN LEGALLY FREE FOR
ADOPTION
64
PERCENTAGE OF POSITIVE EXITS IN PAST 6 MONTHS BY
LAST PLACEMENT TYPEN3,577
65
AVERAGE LENGTH OF STAY IN MONTHS FOR CHILDREN WHO
EXITED CARE IN THE PAST 6 MONTHS BY LAST PLACEMENT
66
(No Transcript)
67
(No Transcript)
68
FAMILY INDEPENDENCE QUALITY ASSURANCE REVIEW
PROCESS
- Reviews are conducted based on the Federal
Management Review Process which is based on
national trends
69
FOOD STAMP PROGRAM POLICY ISSUES
- Outreach
- Case Record ReviewInitial Certifications, Denied
Applications, Terminations, Recertifications
(approvals and closures) - Customer Service Application Process,
interviews with staff/clients/advocates - Hearing Logs
70
CORRECTIVE ACTION
- Quality Improvement Plan/Monitoring
- Corrective Action Plan
- Quality Control Data/Central File
- Error Prone Cases
- Wages and Salaries
- Shelter and Utilities
71
Claims Management
- 5667 Log for OIS Referrals
- Overpayments/Underpayments
- IPV referrals made/documented timely
- Disqualified Recipient Subsystem (DRS) entry
- Sanctions applied timely
- Agency Error/Inadvertent Household Error claims
documented on ADDR NARR screen
72
AGENCY COMPLIANCE PROCEDURES
- Civil Rights/Title VI
- Limited English Proficiency/Sensory Impaired
(LEP/SI) - Americans with Disabilities Act (ADA/Section 504)
- Health Insurance Portability and Accountability
Act (HIPAA)
73
IRS/BEERS SECURITY REVIEW
- Two Barrier Security
- Destruction Logs
- Annual Training/Logs/User Agreement Forms
- UNAX Poster
- County Security Plan
74
Other Review Items
- TANF Participation Activities/Validation of Hours
- TANF Mandatory Forms
75
Three Months and Six MonthsTrends Comparison
Chart
76
Three Months and Six MonthsTrends Comparison
Chart
77
Three Months and Six MonthsTrends Comparison
Chart
78
Three Months and Six MonthsTrend Comparison Chart
79
(No Transcript)
80
(No Transcript)
81
(No Transcript)
82
(No Transcript)
83
(No Transcript)
84
(No Transcript)
85
(No Transcript)
86
(No Transcript)
87
(No Transcript)