
N uptake conditions at the VERTIGO sampling sites - PowerPoint PPT Presentation
1 / 1
Title:
N uptake conditions at the VERTIGO sampling sites
Description:
M Elskens, N Brion, F Dehairs, W Baeyens & N Savoye ... new production rates, and therefore 15N and 13C isotopically la-belled compounds ... – PowerPoint PPT presentation
Number of Views:27
Avg rating:3.0/5.0
Title: N uptake conditions at the VERTIGO sampling sites
1
Nitrogen uptake conditions at VERTIGO study sites
M Elskens, N Brion, F Dehairs, W Baeyens N
Savoye Pleinlaan 2, B-1050 Brussel , Belgium
(melskens_at_vub.ac.be)
- Introduction Nitrogen uptake conditions were
surveyed in the photic zone at station Aloha
2245N-158W du-ring 2004 VERTIGO Hawaii cruise
and at station K2 47N-161E during 2005 VERTIGO
Northwest Pacific cruise using stable isotope
techniques. We aimed at determining new
production rates, and therefore 15N and 13C
isotopically la-belled compounds were used in a
series of tracer experiments conducted over a 3
week period at the VERTIGO sites. - Experimental design
- At station Aloha, combined 15N (NO3, NO2, NH4,
N2) and 13C tracer experiments were conducted
over periods of 12 hours under constant
illumination and neutral density screens to mimic
in situ light attenuation. Sampling depths were
5, 25, 50 125m. - At station K2, 15N (NO3, NH4) and 13C tracer
experiments were conducted over periods of 2, 4
and 6 hours under constant illumination and
neutral density screens to mimic in situ light
attenuation. Sampling depths were 5, 25, 40 50m.
Data analysis A model comparison
approach
- New production assessment
- Primary production PP (13C)
- f-ratio (15N)
- New production PNEW f-ratio x PP
- Integration of PP and PNEW over the euphotic
layer
N uptake conditions at the VERTIGO sampling sites
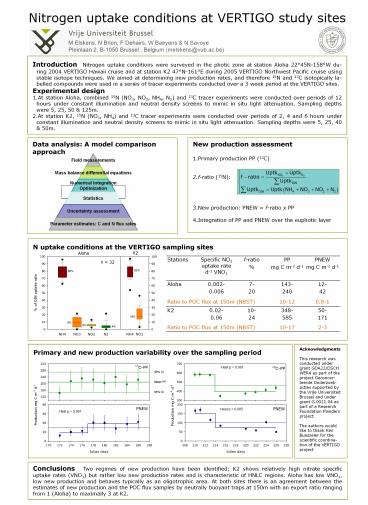
Stations Specific NO3 uptake rate d-1 VNO3 f-ratio PP mg C m-2 d-1 PNEW mg C m-2 d-1
Aloha 0.002- 0.006 7- 20 143- 240 12- 42
Ratio to POC flux at 150m (NBST) Ratio to POC flux at 150m (NBST) Ratio to POC flux at 150m (NBST) 10-12 0.8-1
K2 0.02- 0.06 10- 24 348- 585 50- 171
Ratio to POC flux at 150m (NBST) Ratio to POC flux at 150m (NBST) Ratio to POC flux at 150m (NBST) 10-17 2-3
Primary and new production variability over the
sampling period
Acknowledgments This research was conducted
under grant GOA22/DSCH WER4 as part of the
project Geconcer-teerde Onderzoek-acties
supported by the Vrije Universiteit Brussel and
under grant G.0021.04 as part of a Research
Foundation Flanders project. The authors would
like to thank Ken Buesseler for the scientific
coordina-tion of the VERTIGO project
Conclusions Two regimes of new production have
been identified K2 shows relatively high nitrate
specific uptake rates (VNO3) but rather low new
production rates and is characteristic of HNLC
regions. Aloha has low VNO3, low new production
and behaves typically as an oligotrophic area. At
both sites there is an agreement between the
estimates of new production and the POC flux
samples by neutrally buoyant traps at 150m with
an export ratio ranging from 1 (Aloha) to
maximally 3 at K2.
Recommended
CrystalGraphics Presentations


