
Bonnie Brown - PowerPoint PPT Presentation
1 / 20
Title:
Bonnie Brown
Description:
Working together for clean air. Bonnie Brown. University of Washington. Presented to NWAIRQUEST ... Vaisala 915 MHz radar wind profiler and RASS at Sand Point ... – PowerPoint PPT presentation
Number of Views:26
Avg rating:3.0/5.0
Title: Bonnie Brown
1
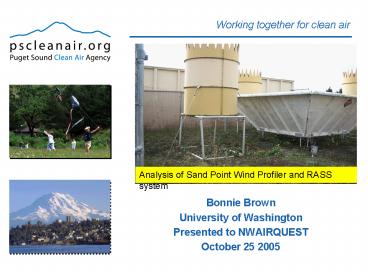
Analysis of Sand Point Wind Profiler and RASS
system
- Bonnie Brown
- University of Washington
- Presented to NWAIRQUEST
- October 25 2005
2
Sand Point Profiler Site
3
Project Details and Goals
- Details
- Vaisala 915 MHz radar wind profiler and RASS at
Sand Point - Virtual temperature and wind data from 2001-2007
on disk - Data is consensus averaged every half hour
- Goals
- Quality control
- Wind and virtual temperature climatology's
- Apply to air quality Temperature inversion
analysis - Use signal to noise ratio (SNR) to determine
boundary layer heights and document precipitation
4
Project Results
- Quality control wind unfolding
- Five year mean profiles of temperature and wind
- Climatology's to be inserted into the trend
graphing and wind rose tools at pscleanair.org - Analysis of burn ban events, identification of
burn ban conditions and inversions - SNR visualization
5
NPN Profilers vs. profiler at Sand Point
- The profiler at Sand Point is a boundary layer
profiler - Higher resolution lower upper bound have
implications for implementing the unfolding
algorithm used by the NPN. - 25 gates in the low mode
- 12 or (less often) 22 gates in the high mode
depending on the date the data is from. - http//www.profiler.noaa.gov/npn/aboutProfilerData
.jsp
6
Wind Folding/Aliasing
- Wind folding occurs when the radial velocity
exceeds the Nyquist velocity (AKA full scale
Doppler velocity AKA unambiguous velocity) and
often makes the wind appear to suddenly and
drastically change direction. - Inconsistent data from important high wind
periods - Miller et al. (1994) describe an algorithm to
unfold profiler winds by using a median check on
the radial velocities - If the measured velocity (Vm) plus or minus two
times the Nyquist velocity is closer to the
median than the measured velocity, it is folded - The median (Vmed) is taken from the seven gates
immediately above (high mode) or immediately
below (low mode). - If it is folded, the measured velocity is
replaced by the true velocity (Vt)
7
Applying Unfolding to the Profiler at Sand Point
- Slight changes have to be made to have an
appropriate algorithm - Since the high mode has fewer gates than NPN
profilers, take the median of 5 gates instead of
7 - Because the high mode ends lower in the
atmosphere, take the median of the gates
immediately below the measured value that are
less likely to be folded, instead of immediately
above. - Once unfolded, the data can be put into a useful
format - Wind rose and trend graphing tools on
pscleanair.org will make this data easily
visualized and available to the Clean Air Agency
and the public. - Virtual temperature data from the RASS is also be
available.
8
Before and After Unfolding
- Seattle 915/RASS
- WINDS rev 4.1
- 47.70 -122.20 11
- 06 02 04 01 37 02 480
- 23 3 12
- 0507 (2.0) 0507 (2.0) 0507 (1.5)
- 132 132 84 84 2800 2800 41 41
- 15.1 15.1 1 3300 3300 12 12 2800 2800
- 216 90.0 216 69.1 306 69.1
- HT SPD DIR Radials...
- 0.322 20.7 177 -0.0 5.7 -4.7 7 7 7 10
5 6 - 0.715 23.6 184 -0.0 7.1 -4.5 7 5 5 6
2 5 - 1.107 9999 999 -0.2 9.4 -3.8 7 4 7 4
0 3 - 1.499 30.3 202 -0.2 10.3 -2.9 6 7 7 4
-2 1 - 1.892 33.3 211 0.1 11.9 -0.9 6 6 6 13
-1 2 - 2.284 34.4 212 1.2 13.3 0.2 6 6 6 22
9 14 - 2.676 44.8 44 1.4 -14.5 -1.0 5 6 5 22
16 21 - 3.069 41.4 50 1.0 -13.4 -2.7 6 7 6 20
15 21 - 3.461 9999 999 0.8 15.0 -4.3 7 3 7 18 14
18
- Seattle 915/RASS
- WINDS rev 4.1
- 47.70 -122.20 11
- 06 02 04 01 37 02 480
- 23 3 12
- 0507 (2.0) 0507 (2.0) 0507 (1.5)
- 132 132 84 84 2800 2800 41 41
- 15.1 15.1 1 3300 3300 12 12 2800 2800
- 216 90.0 216 69.1 306 69.1
- HT SPD DIR Radials...
- 0.322 20.7 177 -0 5.7 -4.7 7 7 7 10
5 6 - 0.715 23.6 184 -0 7.1 -4.5 7 5 5 6
2 5 - 1.107 9999 999 -0.2 9.4 -3.8 7 4 7 4
0 3 - 1.499 30.3 202 -0.2 10.3 -2.9 6 7 7 4
-2 1 - 1.892 33.3 211 0.1 11.9 -0.9 6 6 6 13
-1 2 - 2.284 34.4 212 1.2 13.3 0.2 6 6 6 22
9 14 - 2.676 40.9 207 1.4 15.7 -1 5 6 5 22
16 21 F - 3.069 45.6 203 1 16.8 -2.7 6 7 6 20
15 21 F - 3.461 9999 999 0.8 15 -4.3 7 3 7 18
14 18
9
Products
- Wind Roses
- Low and high mode
- Interactive
- Profiler and RASS data base
- Excel
- Mean virtual temperature profiles
- Inversion Profiles
10
Wind Rose An Interactive Tool
11
Wind Rose 785 m
12
Five Year Mean Temperature Profiles
Early AM hours
13
Five Year Mean Wind Profile-Knots
14
Finding Temperature Inversions
- Instead of looking for plain inversions, look for
conditions that look like burn bans - Take known burn ban periods and find the typical
profile and lapse rates for every hour. - Compare profiles to these typical burn ban
profiles and pick the ones that are similar, or
even more inverted. - When checked with pm 2.5 measurements, a good
indicator of inversions, this method picks
periods of high pm 2.5 whether there was a burn
ban or not. - Most useful for finding periods that threatened
air quality.
15
Examples
16
A Different View
17
Signal to Noise Ratio warm and clear
18
Signal to Noise Ratio cloudy and rainy
19
Whats Left To Do
- Storing and maintaining a database of unfolded
winds - Continued quality control for issues besides wind
folding - Making the data available, especially on the UWs
time series/animation tools, as well as the Clean
Air Agencys website. - Checking and comparing the inversion analysis to
the MM5 output. - SNR analysis to identify the boundary layer and
periods of precipitation. - Continued restoration of old profiler data.
20
Acknowledgements
- Thanks to Mike Gilroy, the Technical Services
Dept. and everyone at the Puget Sound Clean Air
Agency - Prof. Cliff Mass, Neal Johnson and Mark Albright
at the University of Washington Dept. of
Atmospheric Science - Resources
- An Unfolding Algorithm for Profiler Winds, Miller
et al. (1994), Journal of Atmospheric and Ocean
Tech. - Radar Wind Profiler Radial Velocity A Comparison
with Doppler Lidar, Cohn Goodrich (2002).