
Figure 151 Page 305 - PowerPoint PPT Presentation
1 / 30
Title:
Figure 151 Page 305
Description:
Oroville Dam and. Reservoir. Feather. River. Lake Tahoe. Sacramento. Fresno. Hoover Dam. and Reservoir (Lake Mead) Salton Sea. Phoenix. Tucson. ARIZONA. Colorado ... – PowerPoint PPT presentation
Number of Views:85
Avg rating:3.0/5.0
Title: Figure 151 Page 305
1
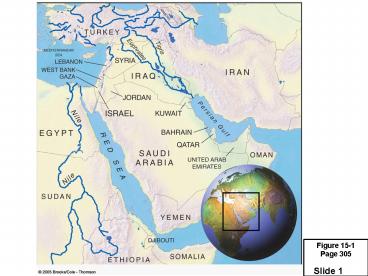
Figure 15-1Page 305
2
Figure 15-2Page 307
All water
Fresh water
Readily accessible fresh water
Groundwater 0.592
Biota 0.0001
Rivers 0.0001
Lakes 0.007
Lakes 0.007
0.014
Fresh water 2.6
Ice caps and glaciers 1.984
Oceans and saline lakes 97.4
Soil moisture 0.005
Oceans and saline lakes 97.4
Ice caps and glaciers 1.984
Atmospheric water vapor 0.001
Soil moisture 0.005
3
Figure 15-3Page 308
Flowing artesian well
Unconfined Aquifer Recharge Area
Well requiring a pump
Precipitation
Evaporation and transpiration
Evaporation
Confined Recharge Area
Runoff
Stream
Recharge Unconfined Aquifer
Infiltration
Water table
Lake
Infiltration
Less permeable material such as clay
Unconfined aquifer
Confined aquifer
Confining impermeable rock layer
4
Figure 15-4Page 309
United States
China
Agriculture 41
Agriculture 87
Power cooling 38
Public 6
Industry 7
Industry 11
Public 10
5
Figure 15-5Page 310
400,000 liters (106,000 gallons)
1 automobile
1 kilogram cotton
10,500 liters (2,400 gallons)
1 kilogram aluminum
9,000 liters (2,800 gallons)
1 kilogram grain-fed beef
7,000 liters (1,900 gallons)
1 kilogram rice
5,000 liters (1,300 gallons)
1 kilogram corn
1,500 liters (400 gallons)
1 kilogram paper
880 liters (230 gallons)
220 liters (60 gallons)
1 kilogram steel
6
Figure 15-6aPage 310
Average annual precipitation (centimeters)
Less than 41
81-22
More than 122
41-81
7
Figure 15-6bPage 310
Acute shortage
Shortage
Adequate supply
Metropolitan regions with population greater than
1 million
8
Wash.
N.D.
Montana
Oregon
S.D.
Idaho
Wyoming
Neb.
Nevada
Colo.
Utah
Kansas
California
Oak.
N.M.
Texas
Highly likely conflict potential
Substantial conflict potential
Moderate conflict potential
Figure 15-7Page 310
Unmet rural water needs
9
Figure 15-8Page 311
Europe
North America
Asia
Africa
South America
Australia
Stress
High
None
10
Figure 15-9Page 313
Downstream cropland and estuaries are deprived
of nutrient-rich silt
Flooded land destroys forests or cropland
and displaces people
Large losses of water through evaporation
Downstream flooding is reduced
Provides water for year-round irrigation
of cropland
Reservoir is useful for recreation and fishing
Can produce cheap electricity (hydropower)
Migration and spawning of some fish are disrupted
11
Figure 15-10Page 314
IDAHO
WYOMING
Dam
Aqueduct or canal
Salt Lake City
Grand Junction
Upper Basin
Denver
Lower Basin
UPPER BASIN
UTAH
COLORADO
Lake Powell
Grand Canyon
Glen Canyon Dam
Las Vegas
NEW MEXICO
Boulder City
ARIZONA
CALIFORNIA
Albuquerque
LOWER BASIN
Los Angeles
Palm Springs
Phoenix
0
100 mi.
San Diego
Yuma
0
150 km
Mexicali
Tucson
All-American Canal
MEXICO
Gulf of California
12
Trade-Offs
Chinas Three Gorges Dam
Advantages
Disadvantages
Will generate about 10 of Chinas
electricity Reduces dependence on
coal Reduces air pollution Reduces CO2
emissions Reduces chances of downstream
flooding for 15 million people Reduces river
sitting below dam by eroded soil Increases
irrigation water for cropland below dam
Floods large areas of cropland and
forests Displaces 1.9 million
people Increases water pollution because of
reduced water flow Reduces deposits of
nutrient- rich sediments below dam Increases
saltwater Introduced into drinking water near
mouth of river because of decreased water
flow Disrupts spawning and migration of some
fish below dam High cost
Figure 15-11Page 315
13
Figure 15-13Page 317
CALIFORNIA
NEVADA
Shasta Lake
UTAH
Oroville Dam and Reservoir
Sacramento River
Feather River
Lake Tahoe
North Bay Aqueduct
Sacramento
San Francisco
Hoover Dam and Reservoir (Lake Mead)
Fresno
South Bay Aqueduct
Colorado River
Los Angeles Aqueduct
San Luis Dam and Reservoir
ARIZONA
California Aqueduct
Central Arizona Project
Colorado River Aqueduct
Santa Barbara
Los Angeles
Phoenix
Salton Sea
San Diego
Tucson
MEXICO
14
Figure 15-14Page 318
CANADA
Hudson Bay
Chisasibi
NEWFOUNDLAND
II
James Bay
I
ONTARIO
II
QUEBEC
New York City
ATLANTIC OCEAN
Chicago
UNITED STATES
15
Trade-Offs
Withdrawing Groundwater
Advantages
Disadvantages
Good source of water for drinking and
irrigation Available year-round Exists almost
everywhere Renewable if not over- pumped or
contaminated No evaporation losses Cheaper to
extract than most surface waters
Aquifier depletion from over- pumping Sinking of
land (subsidence) when water removed Polluted
aquifiers unusable for decades or
centuries Saltwater intrusion into drinking
water supplies near coastal areas Reduced water
flows into streams, lakes, estuaries, and
wetlands Increased cost, energy use, and
contamination from deeper wells
Figure 15-15Page 319
16
Figure 15-16 Page 320
Groundwater Overdrafts
High
Moderate
Minor or none
17
Figure 15-17Page 320
Major irrigation well
Well contaminated with saltwater
Water table
Sea Level
Salt water
Fresh groundwater aquifer
Interface
Interface
Saltwater Intrusion
Normal Interface
18
Solutions
Groundwater Depletion
Prevention
Control
Raise price of water to discourage
waste Tax water pumped from Wells near
surface water Set and enforce minimum
stream flow levels
Waste less water Subsidize water conservation Ba
n new wells in aquifiers near surface
waters Buy and retire ground- water withdrawal
rights in critical areas Do not grow
water- intensive crops in dry areas Reduce
birth rates
Figure 15-18Page 320
19
Figure 15-19Page 321
WYOMING
SOUTH DAKOTA
Less than 61 meters (200 ft)
61-183 meters (200-600 ft)
More than 183 meters (600 ft) (as much as 370
meters or 1,200 ft. in places)
NEBRASKA
KANSAS
COLORADO
OKLAHOMA
NEW MEXICO
TEXAS
Miles
0
100
0
160
Kilometers
20
Figure 15-20Page 324
Center Pivot (efficiency 80 with low-pressure
sprinkler and 9095 with LEPA
sprinkler) Water usually pumped from
underground and sprayed from mobile boom with
sprinklers.
Drip Irrigation (efficiency 90-95) Above- or
below-ground pipes or tubes deliver water to
individual plant roots.
Gravity Flow (efficiency 60 and 80 with surge
valves) Water usually comes from an aqueduct
system or a nearby river.
21
Solutions
Reducing Irrigation Water Waste
- Lining canals bring water to irrigation ditches
- Leveling fields with lasers
- Irrigating at night to reduce evaporation
- Using soil and satellite sensorsand computer
systems to monitor soil moisture and add water
only when necessary - Polyculture
- Organic Farming
- Growing water-efficient crops using
drought-resistant and salt tolerant crops
varieties - Irrigating with treated urban waste water
- Importing water-intensive crops and meat
Figure 15-21Page 324
22
Solutions
Reducing Water Waste
- Redesign manufacturing processes
- Landscape yards with plants that require little
water - Use drip irrigation
- Fix water leaks
- Use water meters and charge for all municipal
water use - Use waterless composting toilets
- Require water conservation in water-short cities
- Use water-saving toilets, showerheads, and
front-loading clothes washers - Collect and reuse household water to irrigate
lawns and nonedible plants - Purify and reuse water for houses, apartments,
and office buildings
Figure 15-22Page 325
23
Figure 15-23Page 325
24
Figure 15-24Page 327
Reservoir
Dam
Levee
Flood wall
Floodplain
25
Figure 15-25aPage 328
Oxygen released by vegetation
Diverse ecological habitat
Evapotranspiration
Trees reduce soil erosion from heavy rain and wind
Agricultural land
Steady river flow
Leaf litter improves soil fertility
Tree roots stabilize soil and aid water flow
Vegetation releases water slowly and reduces
flooding
Forested Hillside
26
Figure 15-25bPage 328
Tree plantation
Evapotranspiration decreases
Roads destabilize hillsides
Ranching accelerates soil erosion by water and
wind
Winds remove fragile topsoil
Agriculture land is flooded and silted up
Gullies and landslides
Heavy rain leaches nutrients from soil and erodes
topsoil
Rapid runoff causes flooding
Silt from erosion blocks rivers and reservoirs
and causes flooding downstream
After Deforestation
27
Figure 15-26Page 329
Solutions
Sustainable Water Use
- Not depleting aquifers
- Preserving ecological health of aquatic systems
- Preserving water quality
- Integrated watershed management
- Agreements among regions and countries sharing
surface water resources - Outside party mediation of water disputes between
nations - Marketing of water rights
- Raising water prices
- Wasting less water
- Decreasing government subsides for supplying
water - Increasing government subsides for reducing water
waste - Slowing population growth
28
Figure 15-27Page 330
What Can You Do?
Water Use and Waste
- Use water-saving toilets, showerheads, and faucet
aerators - Shower instead of taking baths, and take short
showers. - Repair water leaks.
- Turn off sink faucets while brushing teeth,
shaving, or washing. - Wash only full loads of clothes or use the lowest
possible water-level setting for smaller loads. - Wash a car from a bucket of soapy water, and use
the hose for rinsing only. - If you use a commercial car wash, try to find one
that recycles its water. - Replace your lawn with native plants that need
little if any watering. - Water lawns and garden in the early morning or
evening. - Use drip irrigation and mulch for gardens and
flowerbeds. - Use recycled (gray) water for watering lawns and
houseplants and for washing cars.
29
Animation
Polarity of water animation.
Click to view animation.
30
Animation
Dissolution of sodium chloride animation.
Click to view animation.