
CMB component separation and the physics of foregrounds - PowerPoint PPT Presentation
1 / 14
Title:
CMB component separation and the physics of foregrounds
Description:
At first sight one obtains significant correlations with a 'flatter' spectral ... We only detect diffuse Galactic synchrotron at 11 GHz. ... – PowerPoint PPT presentation
Number of Views:35
Avg rating:3.0/5.0
Title: CMB component separation and the physics of foregrounds
1
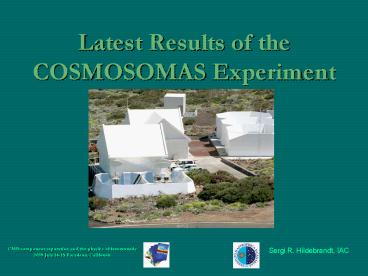
Latest Results of the COSMOSOMAS Experiment
- CMB component separation and the physics of
foregrounds - 2008 July 14-18 Pasadena, California
Sergi R. Hildebrandt, IAC
2
COSMOSOMAS TEAM ISRafael Rebolo (PI)Sergi
Hildebrandt (PS)Carlos M. Gutiérrez de la Cruz
José Alberto Rubiño Martín Roger J.
Hoyland Robert A. Watson (Jodrell Bank)
Former members Silvia Fernández Cerezo
Julio E. Gallegos Juan F. Macías-Pérez
(LPSC, Grenoble) Elia S. Battistelli (University
British Columbia)Roger Oliva Balagué (ESA/ESTEC)
- SUMMARY
- Main features of the COSMOSOMAS Experiment
- Correlation method
- CMB detection
- free-free, synchrotron and radio sources
detection - Signal correlated with far infrared data
- Conclusions and the QUIJOTE CMB experiment
The COSMOSOMAS experiment is placed at the Teide
Observatory in Tenerife island, Spain. Location
16º 30 35 W, 28º 18 00" N, Altitude 2390 m.
Reference Hildebrandt et al., 2007, MNRAS, 382,
594. Web Page http//www.iac.es/project/cmb/cosm
osomas/
3
Main features of the COSMOSOMAS Experiment
CYGNU S A
C
4
Correlation method
Data for different channels (d ) (aprox. 150
good observing days)
X
Our data
Mask
X
X
Templates (t )
Other data
Window function
Mask
d S i a i t i n , where i 0, , N
templates and n is the noise of the data
channel. a is found by a standard Least Square
Fitting. The as are then used to derive the
contributions of the templates that are to be
found in the data and/or mean spectral indexes.
5
CMB detection
COSMOSOMAS
WMAP
C16
C11
W
K
Q
Ka
V
C13
C15
- Detection of CMB in all COSMOSOMAS with an
amplitude around 27/- 2 mK. - In agreement with the expected CMB fluctuations
under our window function (26-27 mK). - We observe a systematic difference between the
two channels at 11 GHz, of order 3, compatible
with the expected polarization of the CMB.
However, more sensitive is needed to call for a
detection.
6
Free-free, synchrotron and
- Free-free emission
- The template used is the Ha map provided by
Finkbeiner 2003. - The correlation values ranges from 3-6 mK at 11
GHz to compatible with 0 up to 33 GHz. - The conversion from Rayleighs to mK is 40-60
mK/R, compatible with the theoretical value of
51-55 mK/R for an electron temperature of
7000-8000 K. - The spectral index is consistent with -2.
- Synchrotron emission
- The template used is the 408 MHz map provided
by Haslam et al 1982. - At first sight one obtains significant
correlations with a flatter spectral index of
-2.5 between 11 GHz and 22.5 GHz. - However at the COSMOSOMAS angular scales the
template is dominated by extragalactic sources
(see next slide). - After a correlation including the NVSS map,
spectral index of Galactic synchrotron turns out
to be compatible with -3. - This result is confirmed with the latest data at
1420 MHz (Burigana et al. 2006).
7
radio sources detection
408 MHz
?
?
NVSS data
8
radio sources detection
408 MHz
NVSS data
We examine the excess of correlation in 11-22 GHz
after taking into account the CMB, free-free and
Galactic synchrotron emission found before. We
get
9
radio sources detection
408 MHz
NVSS data
We examine the excess of correlation in 11-22 GHz
after taking into account the CMB, free-free and
Galactic synchrotron emission found before. We
get
Unresolved radio sources model by de Zotti et
al. 2005.
N. B. same level as the CMB emission.
Observed by COSMOSOMAS and WMAP K band.
Effective spectral index between 11-22.5 GHz
-1.35
10
Signal correlated with far infrared data
- The templates used in the analysis consist of
the DIRBE maps from 25 to 240 mm (DIRBE06, 07,
08, 09 and 10) and the dust map in Schlegel et
al. 1998. - All COSMOSOMAS channels detect correlation with
dust templates at Galactic latitude bgt30º. - The amplitude of the signal ranges from 10-12 mK
at 11 GHz, down to 4-7 mK in the 12-17 GHz and
2.1-2. mK at 22.5 GHz. - The Galactic latitude dependence supports a
Galactic origin.
b - 3
Results for the correlation with DIRBE08 where it
turns out to be more significant
K
b - 2
11
Signal correlated with far infrared data
- Removing few, very intense, regions of 1-5
squared degrees where the spectra is clearly
free-free dominated (but not traced by Ha), we
get
- We fit three models
- A single power-law model. The result is b
0.1 /- 0.2 with a model probability of 46.9 . - The standard spinning dust model of Draine
Lazarian where CNM, WNM and WIM have relative
amplitudes of 0.43, 0.43 and 0.14, respectively.
Model probability is 39.1 . - A phenomenological model with a simple Gaussian
curve. The one plotted. Model probability is in
this case 63.0 .
b - 1
b - 0.1
12
Signal correlated with far infrared data
- Removing a few, very intense, regions of 1-5
squared degrees where the spectra is clearly
free-free dominated (but not traced by Ha), we
get
- We fit three models
- A single power-law model. The result is b 0.1
/- 0.2 with a model probability of 46.9 . - The standard spinning dust model of Draine
Lazarian where CNM, WNM and WIM have relative
amplitudes of 0.43, 0.43 and 0.14, respectively.
Model probability is 39.1 - A phenomenological model with a simple Gaussian
curve. The one plotted. Model probability is in
this case 63.0 .
b - 1
b - 0.1
- Model 1 rules out an spectral index of -1 (5 s
level). - Model 3 implies a peak frequency around 21.7 /-
3.5 GHz. - Correlations with infrared data with shorter
wavelengths (e.g., 25 mm) show less significant
results than 100 mm results.
13
Conclusions
- For the scales allowed by our window function
(1º-5º) - Presence of CMB component of amplitude 27 /- 2
mK in agreement with CMB fluctuations after
taking into account window function. - Unresolved extragalactic sources dominate at 11
GHz. The observations are in very good agreement
with the predictions of de Zotti et al. (2005). - Correlations with the Ha map that obeys a power
law compatible with a -2 temperature spectral
index. - We only detect diffuse Galactic synchrotron at 11
GHz. In the mean, the amplitudes follow a power
law with temperature spectral index of -3. - A dust correlated emission is detected in each of
the COSMOSOMAS channels at bgt30º. The Galactic
latitude dependence of this signal supports a
Galactic origin. On the other hand, an important
fraction of the correlation comes from regions
with high dust emission where free-free emission
is not well traced by Ha map, probably due to
extinction.
14
Do not miss the presentation on Friday of the
Quijote CMB experiment by José Alberto
Rubiño-Martín.
Conclusions
- The remaining emission shows a clear flattening
which is compatible with a free-free index.
However a better description is obtained with
models that resemble spinning dust emission (or
turn-over like models).
The future
Reference Hildebrandt et al., 2007, MNRAS, 382,
594. Web Page http//www.iac.es/project/cmb/cosm
osomas/
Recommended
CrystalGraphics Presentations


