
Midwestern Higher Education Compact - PowerPoint PPT Presentation
1 / 47
Title:
Midwestern Higher Education Compact
Description:
South Dakota Departments of Labor, Education, Health and Tourism and State Development ... However, the United States and South Dakota Both Need Better Workforces To ... – PowerPoint PPT presentation
Number of Views:40
Avg rating:3.0/5.0
Title: Midwestern Higher Education Compact
1
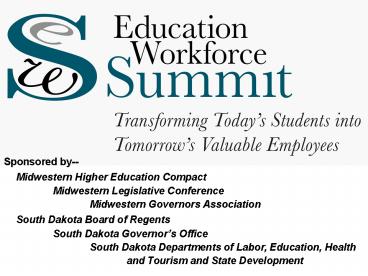
Sponsored by--
Midwestern Higher Education Compact Midwestern
Legislative Conference Midwestern Governors
Association South Dakota Board of Regents South
Dakota Governors Office South Dakota
Departments of Labor, Education, Health and
Tourism and State Development
2
Midwestern Education to Workforce Policy
Initiative Midwestern Higher Education
Compact Midwestern Legislative
Conference Midwestern Governors Association
Policy Summit October 2005 State Roundtables
2006 Policy Report Series 2007 Funded by
MHEC, CSG Lumina Foundation for Education
3
Education to Workforce Conferences
Minnesota, October 23, 2006
Michigan, May 25, 2006
South Dakota, June 27, 2006
Nebraska, May 23, 2006
Missouri April 25, 2006
Illinois, June 14, 2006
Already completed
Later this year or next year
4
Interstate Compacts
NEBHE 1955
MHEC 1991
WICHE 1953
SREB 1948
5
The Commission
- Governs the Compact
- Acts as an instrumentality of state government
in each of the eleven member states - Serves all sectors of public and private
higher education and state government
6
Midwestern Higher Education CompactAdvancing
Education Through Cooperation
- Three Core Functions
- Cost Savings
- Student Access
- Policy Research
7
Todays Purposes and Outcomes
- Share information and ideas with you.
- Encourage you to think about the future of
South - Dakota and how you can help create it.
- Receive from you your ideas on what needs to be
- done in business, education and government to
create more excellent jobs and an excellent
workforce that will create a brighter future for
South Dakota. - Encourage all of you to communicate more on
these issues beyond this conference. - Identify specific action items and plan to
sustain this effort.
8
Highlights
- Demographics in the Future
- Responding to the Age Wave
- SD Advantages
- Workforce Challenges
- Your Needs, Ideas and Advice
9
SD Population Projections 2005 - 2025
AGE 0-4 5-9 10-14 15-19 20-24 25-29 30-34 35-3
9 40-44 45-49 50-54 55-59 60-64 65-69 70-74 75-79
80-84 85
2005 50,663 50,438 54,170 59,412 59,305 46,251
44,244 45,905 56,562 58,773 53,883 43,711 33,425
28,384 26,471 25,139 21,133 18,195 776,064
2010 51,210 50,158 50,162 54,438 57,324 51,741 45
,366 44,209 45,983 56,645 58,873 53,778 43,492 33,
008 27,740 25,606 23,614 22,657 796,004
2015 52,152 50,692 49,907 50,808 52,945 49,659 50,
623 45,328 44,291 46,150 56,812 58,701 53,530 42,9
35 32,259 26,844 24,062 25,779 813,477
2020 51,905 52,043 50,949 51,996 50,462 46,054
48,981 50,830 45,795 44,723 46,582 56,676 58,495 5
2,881 42,094 31,564 25,855 26,615 834,500
2025 49,838 51,874 52,330 53,394 51,685 43,775 45,
498 49,188 51,284 46,266 45,150 46,481 56,449 57,8
20 51,866 41,204 30,380 28,318 852,800
0-19 Most in School
20-64 Primarily income earners and taxpayers
65 Most are Retired
Source State Data Center, Vermillion
10
SD Projections Combined into 3 Groups
AGE 0-19 20-64 65
2005 214,683 442,059 119,322 776,064
2010 205,968 457,411 132,625 796,004
2015 203,559 458,039 151,879 813,477
2020 206,893 448,598 179,009 834,500
2025 207,436 435,776 209,588 852,800
AGE 0-19 20-64 65
2005 28 57 15 100
2010 26 57 17 100
2015 25 56 19 100
2020 25 54 21 100
2025 24 51 25 100
- 4 - 6 10
How will these trends affect all of us? Our
futures? Will we accept
these trends?
Source State Data Center, Vermillion
11
Think of the Age Wave Consequences
AGE 0-19 20-64 65
2005 214,683 442,059 119,322 776,064
2010 205,968 457,411 132,625 796,004
2015 203,559 458,039 151,879 813,477
2020 206,893 448,598 179,009 834,500
2025 207,436 435,776 209,588 852,800
Difference - 7,247 - 6,283 90,266
AGE 0-19 20-64 65
2005 ---- ---- ----
2010 - 8,715 15,352 13,303
2015 - 2,409 628 19,254
2020 3,334 - 9,441 27,130
2025 543 - 12,822 30,579
- 7,247 - 6,283 90,266
More jobs will be needed in the 20-64 group
to provide services for those over 65.
12
Responding to the Age Wage Options
- Less government services to those over 65.
- More tax revenue from a lower number of
taxpayers in - the 20-65 group to pay for elderly services.
- More jobs and therefore more people in the
20-65 group to grow the economy and state
revenues. - Less services to all South Dakotans.
- Using 65 group as a resource.
- More jobs and therefore, more people in the
20-65 - group so tax rates can remain stable.
13
Whats Already Happening Trendlines in SD
Occupations for the Next 6 years
Fastest Growing Occupations Social/Human
Services Assistants Medical Assistants Network /
Data Analysts Self-Enrichment Teachers Medical
Records Technicians Massage Therapists Social
Workers Physician Assistants Residential
Advisors Home Health Aides Respiratory
Therapists Dental Assistants Physical Therapist
Assistants
Fastest Declining Occupations Computer
Operators Meter Readers Typists Eligibility
Interviewers Announcers Travel Agents Prepress
Technicians Electric/Electronic Assemblers Loan
Interviewers and Clerks Locomotive Engineers Data
Entry Workers Order Clerks Mixing Machine
Operators Brokerage Clerks
Source Occupational Outlook, Dept. of Labor
14
Trendlines-- SD Workers by Industry
Fastest Growing by Industry Social
Assistance Ambulatory Healthcare Waste
Management Amusement / Gambling / Rec Museums /
Historical Sites Sport / Hobby / Book
Stores Hospitals Internet Service / Web
Providers Repair and Maintenance Warehousing Nursi
ng / Residential Care Chemical Manufacturing Accom
modations / Lodging
Fastest Declining by Industry Apparel
Manufacturing Textile Mills Computer
Manufacturing Metal Manufacturing Self-Employed
Hunting, Fishing Agriculture-related Beverage
Manufacturing Utilities Federal
Government Broadcasting Plastics
Manufacturing Wholesalers Clothing
Accessories Mining Self-employed Farm Workers
Source Occupational Outlook, Dept. of Labor
15
In Addition to Predicted Job Growth What Else?
Recent History More Energy and Agriculture Big
Stone II Power Plant, Morrell Expansion, 3M,
Dakota Turkey Growers, Qwest, SD Certified Beef,
TransCanada Pipeline, more manufacturing, more
Ethanol, etc
Already Targeted Industry Clusters
Manufacturing, Food Processing, Firearms and
Financial Services.
Long Term Targets for High-Paying Job Growth
Deep Underground Science and Engineering
Laboratory, Research to Commercialization and
spin-offs.
For even more jobs, we want your advice and ideas
during the breakout sessions for now, short-term
and long-term.
16
Taxes - Advantage in Creating New Jobs?
2,203 (21st)
1,910 (35th)
3,094 (6th)
1,430 (50th)
3,418 (3rd)
1,939 (33rd)
2,158 (24th)
South Dakota state tax per person is LESS
THAN ONE-HALF of Minnesotas or Wyomings
state tax per person.
Source http//www.census.gov/govs/statetax/05st
axrank.html
17
Is Per Capita Income an Advantage?
Per Capita Income Rank
Per Capita Income Adjusted for Taxes and Costs of
Living Rank
1999 36th 25th
2005 31th 11th
Your incomes have increased faster than the rest
of the nation and you have held down your taxes
and cost of living.
Sources Bureau of Economic Analysis, US
Department of CommerceTaubman Center, Harvard
University and Dr. Ralph Brown, USD Business
Research Bureau.
18
However, the United States and South Dakota Both
Need Better Workforces To Compete for Future Jobs
An Educated and Trained Workforce is the Key in
Order to Compete
19
Kiplinger Letter, September 23, 2005
- Skilled workers will be harder to find
- Some college or training needed for 85 of new
jobs - Needed
- Health care workers
- Engineers
- Scientists
- Contributing issues to worker shortages
- Baby boom retirements
- Fewer foreign workers
20
South Dakota Educational Attainment and Rank
Among States
19th
78.2
10th
90.1
12th
8.6
31st
24.5
46th
Source U.S. Census Bureau, 2000 Census
6.5
South Dakota Can Do Better in the Future
21
Earnings by Job Type in SD
Source Tony Carnevale and Donna Desrochers, ETS
(PUMS 2000 5 Sample, University of Minnesota,
www.ipums.org, 1998-2000
22
of Population 25-64 with Associate Degree or
Higher
SD 33.1 Nation 33.8
Source U.S. Census 2000
23
of Adults Age 25-64 with Bachelors Degree or
Higher
SD 24.5 Nation 26.5
Source U.S. Census Bureau, 2000
24
of Adults 25 to 64 With Graduate or
Professional Degree
16
15.1
14.4
14.3
SD 6.5 Nation 9.4
12.7
12.4
12.0
11.7
11.6
12
10.8
10.4
10.4
10.2
9.9
9.8
9.7
9.4
9.4
9.4
9.1
9.0
8.9
8.8
8.7
8.6
8.5
8.4
8.3
8.3
8.3
8.1
8.0
7.9
7.7
7.7
8
7.6
7.5
7.5
7.4
7.3
7.2
7.2
7.1
7.1
7.1
6.8
6.5
6.5
6.2
6.1
6.1
6.0
4
0
Utah
Ohio
Iowa
Idaho
Illinois
Maine
Texas
Nation
Hawaii
Alaska
Florida
Virginia
Kansas
Oregon
Indiana
Georgia
Arizona
Nevada
Missouri
Vermont
Montana
Colorado
Michigan
Alabama
Maryland
Delaware
California
Nebraska
Kentucky
Wyoming
Louisiana
Arkansas
New York
Minnesota
Wisconsin
Oklahoma
Tennessee
Mississippi
Connecticut
New Jersey
Washington
New Mexico
Rhode Island
West Virginia
North Dakota
Pennsylvania
South Dakota
North Carolina
Massachusetts
South Carolina
New Hampshire
Source U.S. Census Bureau, 2000 Census
25
Number of Doctorates per 1,000 Workers in Science
and Engineering in SD
As Deep Underground Science and Engineering
Lab develops, more Doctorates will be needed like
other lab states. We will also need more
technicians to help them.
Source Development Report Card for the States,
Corporation for Enterprise Development
26
South Dakotas Research Industry
27
Per Capita RD Expenditures at Doctoral Granting
Institutions, 2002
Source Development Report Card for the States,
Corporation for Enterprise Development
28
Total RD Expenditures Per Capita, 2003
Source National Science Foundation U.S. Census
Bureau
29
Federal RD Expenditures Per Capita, 2003
Source National Science Foundation U.S. Census
Bureau
30
Federal Medical Science RD Per Capita, 2002
Source National Science Foundation U.S. Census
Bureau
31
Federal Life Science RD Per Capita, 2002
Source National Science Foundation U.S. Census
Bureau
32
Federal Computer Science RD Per Capita, 2002
Source National Science Foundation U.S. Census
Bureau
33
Federal Physical Science RD Per Capita, 2002
Source National Science Foundation U.S. Census
Bureau
34
Federal Engineering RD Per Capita, 2002
Source National Science Foundation U.S. Census
Bureau
35
2010 Initiative
- GOAL THREE Become a Recognized Leader in
Research and Technology Development by 2010 - 3A. Secure Homestake Mine for use as an
underground science laboratory - 3B. Improve ranking to at least 30th nationally
for NSF funding - 3C. Develop research and technology
infrastructure at our universities and with the
private sector (Emphasis on research that can be
commercialized and will benefit South Dakota)
36
South Dakota's Research Investment
37
Building and Infrastructure for a Research
IndustryFY05-07 New Investments
38
Forbes Magazine Top 10 Best Small Metropolitan
Cities to Start a Business
1. Sioux Falls, SD 2. Las Cruces, NM
3. Fargo, ND 4. Bismarck, ND 5.
Morgantown, WV 6. Rapid City, SD 7.
Rochester, MN 8. St. George, UT 9.
Johnson City, TN 10. Logan, UT
- Based on
- Cost of Living
- Crime Rate
- Culture / Leisure
- Education
- Income Growth
- Net Migration
Source Forbes magazine, May, 2006
39
For Recruitment, Retention and Productivity--
Adapt the Workplace to Meet the Needs of All
Three Age Groups of Workers
YOUNG (under 34) They are the least satisfied
and least engaged in their jobs and they want
respect, independence, self-defined work
schedules, challenging duties with sufficient pay
or time-off when desired. To keep them happy,
create an engaging, friendly and high performance
environment. Allow them to try different
challenges and opportunities. If they leave,
make it easy for them to return.
MIDDLE (35-54) They may have frustration if
careers are stalled or if they are torn between
work and family obligations. Others in this
group may be reentering the workforce.
Therefore, many are hungry for change. They
value flexibility and aid in meeting their
obligations. They like fresh assignments and
more leadership assignments.
OLDER (55) They may welcome relocation or
travel that they would have rejected when younger
due to family obligations. They may welcome
opportunities to mentor younger colleagues or
work part-time or by assignment or project to
blend retirement with work. When they
retire, some may want to launch new, more
flexible careers.
Source 7,700 Employee survey responses in
WorkForce Crisis and Businessweek, April 24, 2006
40
See the Retiring 65 Group as an Opportunity, Not
a Problem
- Many Older Workers Can Have Higher Levels of
- Job satisfaction,
- Productivity,
- Loyalty/ enthusiasm, and
- Want to stay longer or work part-time
- Many Older Workers Are Less Likely to --
- Job hop,
- Battle with colleagues, or
- Suffer from burnout
- Older Workers Want
- Recognition of experience,
- Meaningful work, and
- Time flexibility.
Source Businessweek, April 24, 2006
41
So what are some issues/ideas?
- Educate populace.
- Set high standards for high school graduation.
- Create public awareness of importance of
education. - Involve private sector in determining actions.
- Are colleges meeting education needs plus
workforce training needs? - Fix leaks in the education pipeline?
- Are you doing everything possible to improve
college access and completion? - Preparation
- Financial Aid
- Incentives
- Is there a working workforce training system?
- Is there access to community college type
programs?
42
So what are some issues/ideas?
- Is being the lowest on some measures an
advantage for - future success?
- Are you marketing South Dakota advantages
strategically? - Are you thinking regionally or globally?
- Involve private sector in determining actions.
- Do your state plans link South Dakotas
postsecondary - resources to South Dakotas future
economic success? - Is this part of South Dakotas higher
education mission? - Public/Private Partnerships
- Centers of Excellence
- Education/training for specific industries or
fields of study - Allied health
- Math science teachers
- Technology workers
- Engineers
- Other?
43
Ideas from the Great Lakes Regional Economic
Initiative
- Create the new learning, research, innovations
- Invite in opening doors to ideas, people and
trade - Build out connect to the world
- Link up with others for synergy strength
- Build skills
- Open immigration policy
- Wired Midwest
- Fix infrastructure
- Open market abroad
44
We want your advice and ideas during the breakout
sessions
- Your reactions to the information presented.
- Your ideas for what other sectors should be
targeted for creating and attracting jobs. - Your recommendations for how business,
education and government can help each other
create a better workforce in SD.
To help prime the pump for breakout discussions,
we will also have some people give us some short
reactions before lunch.
45
SD needs more people
with more skills and education so
it can attract more jobs and
earn more money to boost even more
its healthy economy
for more South Dakotans.
How can you work together to make this happen
over the next 20 years?
46
Some Questions
- Do you want your son or daughter to have a
career that provides health insurance for his or
her family? - Do you want your son or daughter to have a
career that will make it possible to provide a
good home for your grandchildren? - Do you want your son or daughter to have
a career that will make it possible to provide
your grandchildren with extras such as family
vacations, music lessons, summer camp, and
recreational opportunities? - Do you want your son or daughter to have a
career that will make it possible to provide
your grandchildren with a good quality of life
AND be able to invest for their college
education? - Do you want your son or daughter to have a
career that will make it possible to do all
these while also investing for their own
retirement? - Is South Dakota a quality of place that will
make this happen plus attract others?
47
If you dont change your direction, you may
wind up where you are headed. -- Old Chinese
Proverb