
Count of Incident ESRD Patients - PowerPoint PPT Presentation
1 / 16
Title:
Count of Incident ESRD Patients
Description:
Count of Incident ESRD Patients. by Age and Year, 1989-97 ... nephritis Hereditary/ Nephritis/ tension Vascular Unknown. Congenital Pyeloneph. USRDS 1999 ... – PowerPoint PPT presentation
Number of Views:51
Avg rating:3.0/5.0
Title: Count of Incident ESRD Patients
1
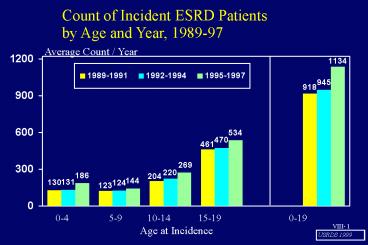
Count of Incident ESRD Patients by Age and Year,
1989-97
Average Count / Year
0-4 5-9 10-14
15-19 0-19
Age at Incidence
2
Pediatric Treated ESRD Incidence Ratesby Race
and Age, 1995-97
Rate / Million Pop./ Year
0-4 5-9 10-14
15-19
Age
3
Pediatric Treated ESRD Incidence Ratesby Sex and
Age, 1995-97
Rate / Million Pop. / Year
0-4 5-9 10-14 15-19
0-19 20-44
Age at Incidence
4
Distribution of Cause of Renal Failure in
Incident Children by Age (in years), 1993-97
Incident Children ()
Glomerulo- Cystic/ Interstitial
Hyper- Collagen Other/
nephritis Hereditary/ Nephritis/
tension Vascular Unknown
Congenital Pyeloneph.
5
Distribution of Cause of Renal Failure in
Incident Children by Race, 1993-97
Incident Children ()
Glomerulo- Cystic/
Interstitial Hyper- Collagen
Other/ nephritis Hereditary/
Nephritis/ tension Vascular
Unknown Congenital
Pyeloneph.
6
Treatment Modality at 2 Years Following ESRD
Onset by Age, 1992-94 Incident Cohort
Incident Children ()
Age Group (years)
Percents add to 100 in each age group
Functioning Center CAPD/
Unknown Death
Transplant Hemodialysis CCPD
Dialysis
7
Average Annual Counts of Pediatric Renal
Transplants by Donor Type, 1995-97
Transplants / Year
Cadaveric
Living
8
Pediatric Transplant Rates by Recipient Age and
Donor Type, 1995-97
Transplants / 100 Dialysis Patient Years
0-4 5-9 10-14
15-19 Total Young Adult
0-19 20-24
Recipient Age at Transplantation
9
Pediatric Transplant Rates by Recipient Race,
Sex, and Donor Type, 1995-97
Transplants / 100 Dialysis Patient Years
White Male White Female
Black Male Black Female
10
Kaplan-Meier 5-Year ESRD Patient Survival by Age
Group, 1991-92 Incident Cohort
Surviving (Kaplan-Meier)
Months
11
Kaplan-Meier 5-Year Patient Survival for
Cadaveric Transplants by Age Group, 1991-92
Transplant Cohort
Surviving (Kaplan-Meier)
Months
12
Kaplan-Meier 5-Year Patient Survival for Living
Donor Transplants by Age Group, 1991-92
Transplant Cohort
Surviving (Kaplan-Meier)
Months
13
Five-Year Graft Survival for First Cadaveric
Transplant by Age Group and Race, 1991-92
Transplant Cohort
Surviving (Kaplan-Meier)
Months
14
Five-Year Graft Survival for First Living Donor
Transplant by Age Group and Race, 1991-92
Transplant Cohort
Surviving (Kaplan-Meier)
Black
Months
15
First Hospital Admission Rates By Age and
Modality, 1997
Admissions / 100 Patient Years At Risk
Hemodialysis CAPD/CCPD
All Dialysis
Preliminary Data
16
Distribution of Causes of Death of Pediatric ESRD
Patients, Ages 0-19, 1995-97
Deaths ()
Death Rate 18.9 /1000 Patient
Years Percentages add to 100
Cardiac Acute MI Other Hyper-
CVD Infection Malig- Hemor- Other
Unknown Arrest Cardiac
kalemia
nancy rhage Known Cause
Causes
Cause of Death
Excluding missing cause, estimated as 15 of
total deaths
Recommended
CrystalGraphics Presentations


