
Microwave Sensing - PowerPoint PPT Presentation
1 / 45
Title:
Microwave Sensing
Description:
Consider a moving automobile that is being tracked by radar, say moving at 100 ... to compensate for the range dependence across the synthetic aperture prior to ... – PowerPoint PPT presentation
Number of Views:195
Avg rating:3.0/5.0
Title: Microwave Sensing
1
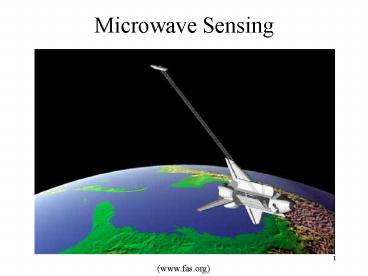
Microwave Sensing
(www.fas.org)
2
Topics
- Microwaves
- Radar
- Range and Azimuth Resolution
- Rate Determination
- Synthetic Aperture Radar
3
Microwaves
- Valuable environmental and resource information
can be acquired in the microwave portion of the
electromagnetic spectrum, from wavelengths of 1
mm to 1m - These wavelengths are about 2,500,000 times
longer than shortest light waves - Two distinctive features characterize microwave
energy from a remote sensing standpoint - Microwaves penetrate atmosphere under virtually
all conditions - Depending on the wavelength -- haze, light rain,
snow, clouds, and smoke can be penetrated - Microwave reflections or emissions from Earth
materials bear no direct relationship to
counterparts in the visible or thermal portions
of the spectrum - Surfaces appearing rough in the visible spectrum
may appear smooth in the microwave regime - Microwaves generally give a different view than
light or thermal spectra
4
The Microwave Radio Spectrum
- Canada Center
- for Remote Sensing
5
Microwave Bands
- Most remote sensing radar wavelengths are between
.5 cm to 75 cm. - The microwave frequencies have been arbitrarily
assigned to bands identified by letter the most
popular imaging radars include - X- band from 2.4 - 3.75 cm (12.5 - 8 GHz).
- Widely used for military reconnaissance and
commercially for terrain surveys. - C- band from 3.75 - 7.5 cm (8 - 4 GHz).
- Used in many spaceborne SARs, such as ERS- 1 and
RADARSAT. - S- band from 7.5 - 15 cm (4 - 2 GHz).
- Used in Almaz.
- L- band from 15 - 30 cm (2 - 1 GHz).
- Used on SEASAT and JERS- 1.
- P- band from 30 - 100 cm (1 - 0.3 GHz).
- Used on NASA/ JPL AIRSAR.
6
Microwave Bands
- Radio wave penetration through a surface layer is
increased with longer wavelengths - Radars operating at wavelengths greater than 2 cm
are not significantly affected by cloud cover,
however, rain does become a factor at wavelengths
shorter than 4 cm.
Canada Center for Remote Sensing
7
Microwaves (Concluded)
- Microwave sensing systems can be active and
passive - An active system supplies its source of
illumination - The passive system, such as a microwave
radiometer, responds to the low levels of
microwave energy that are naturally emitted
and/or reflected by terrain features - RADAR is an acronym, and now a proper noun, from
radio detection and ranging - Data from radar and passive microwave systems are
relatively limited compared to photographic or
scanning systems - Increasing availability of spaceborne radars may
allow the microwave database to catch up - Like RADAR, LIDAR, light detection and ranging,
use an active source with a sensor - Lidars use pulses of laser light, rather than
microwave energy, to illuminate the terrain
8
Radar Configuration
- A transmitter generates radio waves radiated by
an antenna - The receiver, tuned to transmitter frequency,
listens for an echo at the other antenna - The transmitter and receiver generally share an
antenna - The receiver is blanked during transmission to
avoid interference - The antenna concentrates radiated energy into a
narrow beam, thus allowing - Differentiation between targets
- Detection of targets at greater range
- This is called antenna gain, or directivity
9
Some Fundamental Concepts
- Resolution
- Range Resolution
- Azimuth Resolution
- Signal Processing
- Doppler Processing
- Range-Doppler Ambiguities
- Synthetic Array Weighting
- Motion Compensation
10
Range Azimuth Resolution
11
Microwave Resolution
Range Resolution
Azimuth Resolution
(JPL/NASA)
12
Range Resolution
- For pulse duration ?, pulse width c?
- Range resolution c? / (2cos ?d), with no pulse
compression - c light speed, ?d angle of depression.
- Used by conventional and SAR systems
13
Range Resolution with No Pulse Compression
- For no depression angle, range resolution c? /2
- Range Resolution of Two Targets
- Trailing edge of transmitted pulse must have
passed near target before leading edge of echo
from far target reaches near target
14
A Last Look at Range Resolution
?d Depression angle
?I Look angle
Slant range resolution
Ground range resolution
Ground range resolution
?d
?
Slant Range resolution
15
Azimuth Resolution
- Azimuth resolution of side-looking radar (SLR) is
determined by angular beamwidth ? of the antenna
and ground range GR (optimally the value should
be small)
- Objects at points A and B would be resolved, or
imaged separately, better at G-R1 than at G-R2
(Remote Sensing and Image Interpretation)
16
Azimuth Resolution
(Remote Sensing and Image Interpretation)
17
Azimuth Resolution (Concluded)
- Systems where beamwidth is controlled by physical
antenna length are called - Brute force radars
- Real aperture radars
- or Noncoherent radars
- Antenna must be many wavelengths long for antenna
beamwidth to be narrow - 2 mrad resolution requires antenna 25 m long
- Brute force systems, however, are relatively
simple, and large - A means to overcome these deficiencies is
Synthetic Aperture Radar (SAR)
18
Rate Determination
- There are two methods of determining changes of
range, or rate, the variation of distance. - Most static range determination is accomplished
by time of flight sending and return of energy
packets. - The distance is from the radio transmitter is
determined by the delay time of the echo. - Another method, depends on the Doppler effect,
the shifting of frequency of reflected signals
when acted upon by objects in motion. - The rate analysis is best done in the frequency
domain, unlike the time domain analysis for time
of flight signals.
19
Rate Determination by Doppler
- Consider the following diagram
- A source transmitting a continuous sinusoidal
wave - The wave crosses a distance to a stationary object
- The object reflects, or scatters the energy
- Some of the reflected energy is sent back to the
source - This received wave is the same frequency as which
left the source, fobject ftx
20
Rate Determination by Doppler
Canada Centre for Remote Sensing
21
Rate Determination by Doppler
- Now imagine the object moving to the right, away
from the source, at velocity v. - The waves will intercept the object at a lower
frequency by
v
- where
- v velocity of moving object with respect to the
source - c speed of light
- If the object is moving away from the source, the
distance is increasing, thus v gt 0, hence the
minus sign to show that fobject lt fTX.
22
Rate Determination by Doppler
- This is only half the analysis the moving object
scatters the wave and sends part of the energy
back in the direction of the source. - The received wavelength at the moving object,
?object c/fobject, is transmitted as a longer
wavelength, since the generation of this
reflected electromagnetic wave is from a moving
object away from the original source. - This new wavelength, allowing for both the object
moving away () and towards () the source, is
23
Rate Determination by Doppler
- Combining these two equations to find the final
reflected frequency at the source, yields - The upper sign designates the object is moving
away from the source, and the lower sign
designates the object is moving toward the
source.
24
Rate Determination by Doppler
- It is assumed here that vltltc, so relativistic
effects are ignored, and thus this equation can
be simplified by expanding the Doppler factor
about a Taylors series and ignoring all but the
first two terms - This gives
25
Rate Determination by Doppler
- But how to best analyze the signal?
- Frequencies in the microwave x or k bands are
very high compared to a Doppler shifted
displacement frequency. - Consider a moving automobile that is being
tracked by radar, say moving at 100 km/hour, or
about 27.8 m/s - The Doppler shift factor is
26
Rate Determination by Doppler
- For a nominal x-band microwave frequency of 10
GHz, the reflected wave is thus 9.99999800000
GHz, a difference of only 1853 Hz, or less than
210-5 - This is difficult to sense, and then compare with
the nominal transmitted frequency. - A way to detect the shift easier is by
interference, or beating the signals together.
27
Rate Determination by Doppler
f0 Oscillator
Radar Antenna
Output of consisting of cos(f0)cos(fRX)
fRX Signal
Mixer
- This is a diagram of a superheterodyne mixer that
beats an incoming signal with an oscillator wave.
28
Rate Determination by Doppler
- The result of mixing two signals, here assumed to
be sine wave signals of the nominal transmitted
signal cos(f0), and the received Doppler shifted
signal cos(fRX), is - cos(f0)cos(fRX) cos(f0fRX) cos(f0fRX)/2
- Note that the beated signals produce both a sum
and a difference frequency - The next receiver stage is tuned to the second
terms relatively small difference frequency - This frequency is also proportional to the speed
of the object
29
Rate Determination by Doppler
- The difference frequency of a Doppler shifted
wave being reflected off of a 100 km/hr
automobile is 1.853 kHz, in the audio frequency
(ELF) range, quite different than the SHF
carrier. - A means to confuse the ranging transmitter is to
send the nominal radar frequency wave but
modulated with an audio frequency representing a
low automobile speed at a signal strength higher
than the reflected Doppler shifted wave.
30
Synthetic Aperture Radar
(Sandia)
31
Synthetic Aperture (alias Array) Radar (SAR)
Background
- Different operations require broad area imaging
at high resolution, such as - Environmental monitoring
- Earth-resource managing
- Military systems
- Imagery must be acquired in bad weather and night
as well as day - SAR has provided this capability
- Terrain structural information for mineral
exploration - Oil spill boundaries
- Sea state and ice maps
- Reconnaissance and targeting information
32
SAR Fundamentals
- Airborne SLR images are taken perpendicular to
flight path direction - Two dimensional (2-D) image typically produced
- One dimension is called range, or cross-track
dimension - Measure of line-of-sight distance
- Precisely measure transmission to reception time,
or time of flight - Resolution determined by pulse width or
compressed pulse width - The other dimension is called azimuth, or
along-track dimension - Physically large antenna focuses the transmitted
and received energy into a sharp beam - Optical systems--telescopes--also require large
aperture mirrors or lenses to obtain fine imaging
resolution - SLR systems--much lower in frequency than optical
systems--need a physically unrealizable antenna
for use on-board a plane
33
SAR Fundamentals (Continued)
- The bottom line is that SLR resolutions need
antenna lengths on the order of several hundred
meters - The saving feature is that airborne radar can
collect data while airplane flies the
corresponding distance - Data is then processed as if it came from a
physically long antenna - The distance the radar source flies in
synthesizing the antenna is known as the
synthetic aperture - A narrow synthetic beamwidth results from the
long synthetic aperture, thus a finer resolution
is obtained than is possible with a smaller
physical antenna
34
SAR Fundamentals (Continued)
- The realization of SAR fine azimuth resolution
can also be approached from a Doppler processing
standpoint - A targets position along the flight path
determines the Doppler frequency of its echoes - Targets ahead reflect a positive Doppler offset
- Targets behind reflect a negative Doppler offset
- The aircrafts flight through the synthetic
aperture distance allows echoes to be resolved
into a number of Doppler frequencies - Thus the targets Doppler frequency determines
its azimuth position
35
Synthetic Array Radar (SAR)
(ASF)
36
SAR Fundamentals (Continued)
- Transmitting pulses short enough to provide the
desired resolution are generally not practical - Longer pulses with wide bandwidth modulation are
typically transmitted for pulse compression
purposes - Peak power requirements are reduced
- For even moderate azimuth resolutions, SAR
processing is complicated, requiring digital
signal processing (DSP) - Energy reflected from the target must be
mathematically manipulated to compensate for the
range dependence across the synthetic aperture
prior to image development - For fine resolution imagery, range and azimuth
channels are coupled, which greatly increases
complexity and computational processing
37
What Is Imaging Radar?
- Provides illumination of ground area
- Uses antenna and digital computer tapes to record
image - Brighter areas mean higher back-scatter
- Rule of thumb is that brighter backscatter on
image means rougher surface being imaged
(Virtual Science Centre)
38
Radar Shadows
(ccrs.nrcan)
39
Science Objectives of Imaging Radar
- Complementary to visible, near IR, and thermal IR
- Waves penetrate clouds
- Provides own illumination and produces reliable
multi-temporal data independent of weather or
solar illumination - Can penetrate--under certain circumstances--vegeta
tion canopies and very dry sand or soil, making
it possible to examine near-surface zones - Side-looking geometry better for viewing of 3D
features
(Virtual Science Centre)
40
Diffuse and Specular Reflectance
Canada Center for Remote Sensing
41
Specular Reflectance and Diffuse Scatter
- Microwave reflectivity is a function of surface
roughness, and thus the brightness of features on
radar imagery. - Smooth surfaces, where roughness height ltlt ?,
reflect most of the incident energy in one
direction, are called specular reflectors, from
the Latin word speculum, meaning mirror. - Such specular surfaces, as calm water or playas,
appear dark on radar imagery.
- Microwaves incident upon a rough surface are
scattered in broader directions, including back
at the source - this is known as diffuse scatter
or distributed reflectance. - Vegetation surfaces will cause diffuse scatter,
and result in a brighter tone on the radar
imagery.
Canada Center for Remote Sensing
42
Surface Roughness
Canada Center for Remote Sensing
43
Surface Roughness
- Roughness of a scattering surface is a function
of radar wavelength and incident angle. - A surface is considered smooth if its height
variations are smaller than the radar wavelength,
and rough when greater.
- A surface appears rougher as incident angle
increases. - Rough surfaces will usually appear brighter due
to backscatter on radar imagery than smoother
surfaces of like material.
Canada Center for Remote Sensing
44
Supplemental References
- Lillesand, T.M., R.W. Kieffer, J.W. Chipman,
Remote Sensing and Image Interpretation, Wiley
publisher - Radar Imaging, http//southport.jpl.nasa.gov
- Remote Sensing Tutorial, http//rst.gsfc.nasa.gov
- The Virtual Science Centre Project on Remote
Sensing, http//www.sci-ctr.edu.sg/ssc/publication
/remotesense/rms1.htm - Microwave Remote Sensing, http//www.ccrs.nrcan.gc
.ca/ccrs/eduref/tutorial/chap3/c3p4e.html - IFSAR and Shuttle Radar Topography Mission
(SRTM), http//www.fas.org/irp/program/collect/isf
ar.htm
45
Supplemental References
- What is Synthetic Aperture Radar? Sandia
Laboratories, Brian Mileshosky,
http//www.sandia.gov/RADAR/whatis.html - SAR Imagery Sandia Laboratories,
http//www.sandia.gov/images/estancia.html - Radar Band Designations, http//geog.hkbu.edu.hk/G
EOG3610/Lect11/sld016.htm - Synthetic Imaging Radar, http//geog.hkbu.edu.hk/G
EOG3610/Lect-05 - The Planet Venus, http//csep10.phys.utk.edu/astr1
61/lect/venus/venus.html - Canada Centre for Remote Sensing, Fundamentals of
Remote Sensing, http//www.ccrs.nrcan.gc.ca/ccrs.
Recommended
CrystalGraphics Presentations


