
Visual Analytics: A Global Collaboration - PowerPoint PPT Presentation
1 / 30
Title: Visual Analytics: A Global Collaboration
1
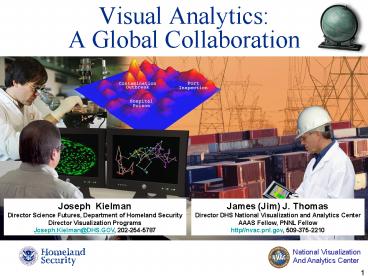
Visual AnalyticsA Global Collaboration
James (Jim) J. Thomas Director DHS National
Visualization and Analytics Center AAAS Fellow,
PNNL Fellow http//nvac.pnl.gov, 509-375-2210
Joseph Kielman Director Science Futures,
Department of Homeland Security Director
Visualization Programs Joseph.Kielman_at_DHS.GOV,
202-254-5787
2
Why We Should Care About Visual Analytics -
Three Trends
- Digitization
- Mining and Analysis
- Simulation
- Super Crunchers Ian Ayres
- The World Without Us Alan Weisman
3
Selected Societal Drivers and Observations
- Scale of Things to Come
- Information
- In 2002, recorded media and electronic
information flows generated about 22 exabytes
(1018) of information - In 2006, the amount of digital information
created, captured, and replicated was 161 EB - In 2010, the amount of information added annually
to the digital universe will be about 988 EB
(almost 1 ZB) - A Forecast of Worldwide Information Growth
Through 2010 IDC - National Open Source Enterprise - Intelligence
Community Directive No. 301, July 11, 2006 - UC Berkeley School of Information Management and
Systems Now much Information
4
Selected Societal Drivers and Observations
- Scale of Things to Come
- Information
- Drivers of Digital Universe
- 70 of the Universe is being produced by
individuals - Organizations (businesses, agencies, governments,
universities) produce 30 - Wal-Mart has a database of 0.5 PB it captures
30,000,000 transactions/day - The growth is uneven
- Today the United States accounts for 41 of the
Universe by 2010, the Asia Pacific region will
be growing 40 faster than any of the other
regions
5
Selected Societal Drivers and Observations
- Scale of Things to Come
- Information
- Drivers of Digital Universe
- Kinds of Data
- About 2 GB of digital information is being
produced per person per year - 95 of the Digital Universes information is
unstructured - 25 of the digital information produced by 2010
will be images - By 2010, the number of e-mailboxes will reach 2
billion - The users will send 28 trillion e-mails/year,
totaling about 6 EB of data
6
Selected Societal Drivers and Observations
- Scale of Things to Come
- Information
- Drivers of Digital Universe
- Kinds of Data
- Interaction (ref 2007 Dagstuhl - key selected
topic for workshops) - Today's interaction designed for point and click
on individual items, groups(folders), and lists - Today's interaction assumes user knows subject,
concepts within information spaces, and can
articulate what they want - Today's interaction assumes data and
interconnecting relationships are static in
meaning over time - Today's interaction is one way initiated
- Todays interaction (WIMP) designed over 30 years
ago
7
Multiple Techniques Contribute to Threat
Assessment
Prediction
Synthesis
Visual Analytics
Cognition
Graph Matching
Analysis
Pattern Analysis
Content Management
Evidence Extraction
Organization
Link Discovery
Integration
Connect the Dots
Extraction
Aggregation
Data Information
Knowledge
8
Questions
- What is the true measure of security?
- Risk vs. Resilience
- How do we innovate?
- Requirements-driven vs. Use-inspired
- What determines the value of information?
- What we know vs. What we think we know
- How de we judge performance?
- Scale vs. Relevance
- Whats the market?
- Analyst vs. First Responder
9
Whats Needed
- Focus on the internal rather than the external
- Consideration of the meaning of our facts
- Appreciation of resilience factors
- Irrelevance of scale
- Application and implementation
- Expansion of the Visualization and Analytics
Complex
10
Science Futures Research
- Visual Analytics and Physics-based Simulation
Program - Visually based mathematical methods and
computational algorithms for discovering,
comprehending, and manipulating diverse data and
applying the resulting knowledge to anticipate
terrorist incidents or catastrophic events and
guide response and recovery activities - Data-intensive Computing, Privacy, and Forensics
Program - Simpler, more efficient software algorithms and
hardware architectures for extracting and
managing data, assessing threats and
consequences, ensuring information privacy,
securing the cyber infrastructure, and ensuring
telecommunications interoperability
- HIGHLIGHTS
- Canada-USA Collaboration - Collaborative
Activity Agreement (CAA) under existing Canada
USA treaty between DHS ST and Defense Research
and Development Canada - Visualization and Analytics Complex The
National Visualization and Analytics Center
(NVAC), 5 university-based RVACs, 2 GVACs, and 20
industry partners - National Research and Development Agenda
11
Visualization and Analytics Centers
Detecting the Expected -- Discovering the
UnexpectedTM
12
Fall 2007 VAC Consortium
13
VAC Vision (edited by Consortium Members)
- VAC Values
- Thought leadership in the sciences, technologies,
and processes involved in visual analytics - Impact on client missions
- Demonstrated understanding of client and end user
needs - Effectiveness to innovate, incubate, develop,
disseminate, and promote science and technology - Productive collaborations and respectful
competition - Building an enduring visual analytics community
- Effective VAC communications to the public
- Welcome, meaningful, and fun experience for all.
14
Visual Analytics Capabilities
15
Example Technology ProductsIN-SPIRE Advanced
Text Analysis Platform
- Cluster and Thematic views
- Evidence Evaluation
- Triage Networks
- Visual analysis for multiple languages
- Multi-Viewpoint Support
- Affect and Emotion Measures
- Correlation Analysis
- Streaming Data
- Collaborative Team Analytics
http//in-spire.pnl.gov
16
The Assessment Wall
Developed an interactive information
visualization system that provides an up-to-date
overview and helps users intuitively find
documents of interest on a large touch display.
- A walk-up usable interface that provide anyone
instant analytical capability. - Designed for team collaboration and discussion
of analytical tasks. - Simple interface design to provide rapid
analytical results is ideal for command room
style utility.
17
Integrating Structured/Unstructured Text, Form,
and Data Base Visual Data Analysis
18
Scalable Reasoning System
A free-form visual environment and knowledge base
scaling across mobile devices and desktop
interfaces that integrates methods for organizing
data, reasoning with information, and
disseminating knowledge.
- Uses light-weight interaction and visualization
techniques to support use by any analyst. - Designed for real-time collaborative tasks and
sharing of knowledge across distributed teams. - Assists in vetting of knowledge products through
dissemination of the evidence and analysis that
contributed to a product.
19
Law Enforcement and Counter-Terrorism
Desktop to Handheld Enabling cross-jurisdictional
situational awareness for rapid decision making
and resource deployment
SRS/DCAF
Intuidex
20
Interactive Graph Analytics
An integrated problem-solving environment
providing novel interactive visualization of
graphs with up to 1 million nodes, feature
extraction techniques, and topological and
semantic analysis.
Going from huge connected graphs to proximity
clusters
- Real-time scalable algorithms provide
visualization support to most any application
with graph data. - Feature extraction and clustering can be used to
provide different perspectives for semantic
graphs in domains such as power grid analysis to
environmental sensor analysis.
Visualizing a collection of transmission system
lines
21
Interactive Graph Analytics
22
Case Studythe 8/10/96 Disturbance
23
Threat Stream Generator
Creating the science for developing realistic,
synthetic data sets, based on scenarios, with
known ground truth for testing and evaluation of
analytical tools and techniques
- The data sets and evaluation methods can be
applied to a wide range of analytical tasks to
determine the value of tools and techniques. - Development of better testing methodologies will
result in more rapid and superior tool
development.
Of all of the data generators that I have
seen/heard about in my time at the ICAHST, PNNLs
seems to be the one that simulates the real world
the most effectively. - ICAHST Testing
Manager
24
Selected Other Programs
- Over 80 projects
- User guided rapid analytics first look
- Active products dynamic tailored multimodal
assessment product - Information Synthesis mathematic foundations for
semantic synthesis - Science of interaction starting with John Stasko
at PNNL - RVACs each have 5-8 projects to be discussed by
RVAC leads - Several Collaborative projects NVAC-Industry,
RVAC-RVAC, RVAC-NVAC-Industry, RVAC-industry, - Look forward to adding to many
of these
CANVAC
25
Top Ten Challenges within Visual Analytics
- Human Information Discourse for Discoverynew
interaction paradigm based around cognitive
aspects of critical thinking - New visual paradigms that deal with scale,
multi-type, dynamic streaming temporal data flows - Data, Information and Knowledge Representation
- Predictive/Proactive Visual Analytics
- Visual Analytic Method Capture and Reuse
26
Top Ten Challenges within Visual Analytics
- Dissemination and Communication
- Visual Temporal Analytics
- Validation/verification with test datasets openly
available - Delivering short-term products while keeping the
long view - Interoperability interfaces and standards
multiple VAC suites of tools
27
Education
- RVAC interns
- Interns and scholars
- Visual analytics curriculumand digital library
- Analyst internships
- IEEE VAST conferenceand graduate colloquium
Watch andWarn TrainingClass
2006 Interns
28
(No Transcript)
29
Spring Consortium and IEEE VAST 2008
- Spring VAC Consortium May 21-22, 2008 in DC area
- IEEE Symposium on Visual Analytics Science and
Technology (VAST) 2008 - http//conferences.computer.org/vast/vast2008/
- Columbus, Ohio
- Oct 14-19, 2008
30
Visual AnalyticsA Global Collaboration
James (Jim) J. Thomas Director DHS National
Visualization and Analytics Center AAAS Fellow,
PNNL Fellow http//nvac.pnl.gov, 509-375-2210
Joseph Kielman Director Science Futures,
Department of Homeland Security Director
Visualization Programs Joseph.Kielman_at_DHS.GOV,
202-254-5787
Recommended
CrystalGraphics Presentations


