
Geospatial Data - PowerPoint PPT Presentation
1 / 38
Title:
Geospatial Data
Description:
Spatial metaphors in information search and retrieval. Topic Maps ... Immersive technologies (e.g., ImmersaDesk & CAVE) can be used by one person at a time. ... – PowerPoint PPT presentation
Number of Views:45
Avg rating:3.0/5.0
Title: Geospatial Data
1
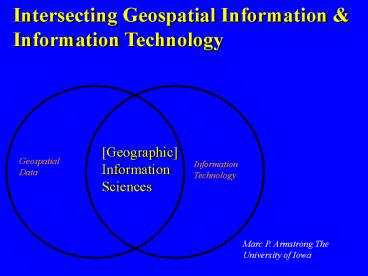
Intersecting Geospatial Information Information
Technology
Geographic Information Sciences
Geospatial Data
Information Technology
Marc P. Armstrong The University of Iowa
2
Intersecting Geospatial Information Information
Technology
Visualization HCI Group Work
Geospatial Data
Information Technology
Marc P. Armstrong The University of Iowa
3
GIS technologies and geospatial information
Play key roles in everyday life, and support
complex scientific investigations and informed
public and private sector decision making.
4
Limitations of GIS
- Despite advances during past two decades,
significant limitations persist - GIS software is ill-suited for use by groups
task forces/committees/panels that are convened
to address complex policy problems. - GIS software is complex education lags.
- Two dimensional maps are inadequate for
visualizing high-dimensional information and
require users to have map reading skills (big
assumption).
5
GIS software is designed for single users.
!
?
This can create a bottleneck effect, isolating
decision-makers and requiring the presence of an
expert user to elicit preferences from them.
Source Armstrong, 1998
6
A better approach enables decision-makers to work
both directly and cooperatively to search for
solutions to complex problems.
!
?
?
Source Armstrong, 1998
7
Interaction effect complexity is increased when
multiple stakeholders criteria are involved.
a.
b.
Fails public water supplies criterion
GIS analyses can be complex.
Public water supplies
Buffer (1mi)
Fails private water wells criterion
Private water wells (UTM)
Buffer (1000)
Private water wells
Project
Address Match
Private water wells database
Overlay
Areas that fail screening criteria
Select freq 100
Fails floodplain criterion
Floodplain
Soils
Fails land use criterion
Fails depth to water table criterion
Select water table lt 5ft
Soils w/ depth to water tab.
Join
Soils database
Overlay
Digitize
Fails distance to property line criterion
Buffer (50)
Parcels
Parcels
Fails resid. development criterion
Landuse (polygon)
Select LUResid.
Residential development
Landuse (raster)
Raster? vector
Buffer (500)
Source Bennett and Armstrong, 2001.
8
Large Conceptual Barriers to Use
- Education about geographic fundamentals (e.g.,
scale) is needed - Science and technology overlap (GIScience Info
Sciences) can help erode barriers - GIS user interfaces, visualization, group work
- Result will be improved ability to cope with
geospatial data
9
The ideal user interface
10
The ideal user interface
Easy to understand and unambiguous.
11
What do we have instead?
- Complexity
- Original command line (good for careers, but
akin to JCL (not Java Constraint Language) for
newbies IEF640I EXCESSIVE NUMBER OF POSITIONAL
PARAMETERS) - Move toward GUI, objects drag drop for
model creation - New modeling and interface metaphors
12
Spatial metaphors in information search and
retrieval
- Topic Maps (www.topicmaps.org for specs)
- Graphical representations (www.inxight.com)
- Spatial info-navigation metaphors- (M.
Czerwinski, Microsoft http//antarcti.ca/)
See Martin Dodges An Atlas of Cyberspaces
http//www.cybergeography.org/atlas/atlas.html
13
Spatial metaphors are the focus of several
e-business initiatives
Several examples are at http//www.map.net
14
Recursive Metaphor- using a virtual earth
representation to access geospatial information
http//www.ai.sri.com/digitalearth/
15
Task Specificity of Metaphors
- Previous examples focused on information access
and retrieval. - Much of GIS involves analysis of geographic
information and different metaphors may apply. - Geographers Desktop from U of Maine is one good
example
16
Geographers Desktop Map Cabinet Metaphor
Source Max Egenhofer
17
Pictographic Representations of Map Algebra
Source Max Egenhofer, UMaine
18
But are we skating to the puck?
- Guy LaFluer, when asked why he was such a great
hockey player, paused and then replied - Other players skate to where the puck is. I
skate to where the puck will be.
19
GIS, Viz, HCI, CSCW A Scenario
- A train derailment occurs in January on a track
in rural Iowa that is situated along a bluff that
overlooks the Mississippi River. - Two tanker cars threatens to release a highly
toxic substance. - Local expertise in handling this type of
emergency is absent.
20
Uh Oh
- Responders need expert advice to create of an
emergency plan. - They turn to a chemical engineer, hydrologist and
an expert in topographic analysis. - Digital terrain information (a DEM) is
downloaded. - Information about the toxic substance and
atmospheric conditions are put into a dispersion
model.
21
Teleimmersion Analysis
- The team uses the DEM and a 3D plume dispersion
model in a teleimmersive environment. - The dispersion model indicates that since it is
January (-10C) the chemical is non-volatile and
will flow as a liquid (like molasses in Jan). - The DEM helps the team to visualize that the flow
will be blocked from entering the Mississippi
immediately because of a levee.
22
Far Fetched?
- Consider developments in technology and their
effects on GIS use
23
Modified after MacEachren et al.
24
Single User Workstation
25
CSCW, digital conferencing
26
Teleimmersion
27
Immersion
- Economics of display technologies force 2D
output. - This limits insight and creates problems (e.g.,
project 3D ? 2D). - Immersive visualization enables users to
experience realistic environmental
representations and examine high-dimension
information. - Immersive technologies (e.g., ImmersaDesk CAVE)
can be used by gt one person at a time. Think
Holodeck
28
3D topographic model of Iowa River valley using
Viz5D running on an ImmersaDesk.
Source Wang and Armstrong, 2000.
29
Teleimmersion
- Synchronous use of immersive visualization by two
or more people over a network (e.g., Internet2,
MAGIC). - Also called collaborative virtual environments
(CVE). - Research focus of NSF ITR, and NSF Distributed
Terascale Facility.
Communication through Network
Sourcehttp//fakespacesystems.com
30
Teleimmersion a research challenge that unites
HCI, Visualization and CSCW.
It also underscores need for HPC/Grid for
near-real-time interaction.
Prototype teleimmersive grid cell GIS with a
slider bar user interface.
Source Wang and Armstrong, 2000.
31
Animation
Source Wang and Armstrong, 2000.
32
(No Transcript)
33
(No Transcript)
34
(No Transcript)
35
Representation of Decision-Makers
Virtual personae avatars. This is a crude
head arm(face and pointer) representation.
Source Wang and Armstrong, 2000.
36
Realism improves usability?
Source Wang and Armstrong, 2000.
37
Teleimmersion Research Issues
- What is an appropriate interface for
teleimmersive GIS? - What level of geographical realism is appropriate
in a teleimmersive GIS? What level of realism is
appropriate for avatars? - How is group use handled (computer
mediated/virtual aggression, dominance and
submission) and how are mapped results
synthesized (e.g., areas of agreement and
disagreement)? What tools are needed? A new group
map algebra? - How do we support a simultaneous computational
need to track users, render spaces and analyze
data (using NP-hard models)? - How do we address generic technical problems,
such as latency and jitter, in data-rich
teleimmersive GIS?
38
//SYSIN DD DSNAUDIENCE.QUESTIONS
Recommended
CrystalGraphics Presentations


