
NAPLES - PowerPoint PPT Presentation
1 / 9
Title:
NAPLES
Description:
Naples population: 1,004,500 inhabitants. Peak hour modal share: private motorised 61 ... PROPOLIS Naples case. A. Martino / TRT ... Naples Conclusions ... – PowerPoint PPT presentation
Number of Views:204
Avg rating:3.0/5.0
Title: NAPLES
1
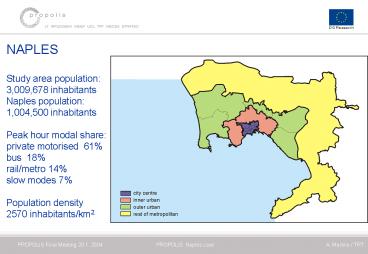
NAPLES Study area population 3,009,678
inhabitants Naples population 1,004,500
inhabitants Peak hour modal share private
motorised 61 bus 18 rail/metro 14 slow modes
7 Population density 2570 inhabitants/km2
2
Environmental index
Social index
3
Policy comparisons economic index
4
Naples Conclusions
The base scenario shows that the existing level
of sustainability cannot be maintained as the
social aspects of equity and accessibility, and
the overall environmental indicators deteriorate
(except for the theme related to air pollution).
Concerning the environmental component, the
tested policy elements have always better indices
if compared with the 2021 base scenario. The
situation is less linear when looking at the
social component of sustainability.
5
Reference scenario traffic noise 2001 and
difference 2021 v. 2001
6
Combination policy
Population and employees variation compared
with the Reference Solution Year 2021
7
Naples Conclusions
The best results among pricing policies are
obtained by the increasing car operating cost
policies. Their main impacts include the
densification of central areas, more balanced
modal shares, decreased road congestion and good
results for the environmental, social (except
equity aspects) and economic indices. The other
pricing policies have similar, although less
relevant, results and the side effect of
accelerating the urban sprawl.
8
Naples Conclusions
Regulation policies have a moderate impact,
which is the net result of the positive outcome
for the environmental indicators and the health
component of the social index and the negative
performance of the other social indicators as
well as of the economic index. Policies
concerning the decrease of the PT fares have
significant impacts in terms of population and
employees concentration and of sustainable
mobility.
9
Naples Conclusions
All policy combinations include a 50 increase of
the car operating costs and show a concentration
effect on population and workplaces. Average
travel distances and the modal share of private
modes of transport decrease, with positive
effects on congestion. And these changes have
obviously relevant impacts on the environmental
indicators. On the other hand, the social
components of sustainability - equity,
opportunity and accessibility slightly
deteriorate.
Recommended
CrystalGraphics Presentations


