
Modeling System Requirements: Events and Things - PowerPoint PPT Presentation
1 / 58
Title: Modeling System Requirements: Events and Things
1
LECTURE 5. Modeling System Requirements Events
and Things
2
- The last lecture introduced the techniques for
gathering information. This lecture - presents techniques for documenting the
functional requirements by creating a variety - of models.
- Models and Modeling
- A collection of models is the best way to
describe the requirements for an information - system.
- A model is a representation of some aspect of
the system being built - Because of complexity of a system, a variety
of models should be created to present - the detailed information collected during the
analysis phase - Many models are graphical (e.g. Data flow
diagram, ER diagram) - Can show different levels of detail (or
levels of abstraction) - Some focus on data
- Some focus on processing
- The Purpose of Models
- Creating a model can help clarify and refine
the design - Developing the model raises questions that
need to be considered - Models help to simplify complex aspects of
systems
3
Reasons for Modeling Learning from the
modeling process New pieces are found during
the modeling to be added New questions arise
that need to be answered to complete the model
Reducing complexity of the information system by
abstraction Systems can be complex and
intangible Models of parts of the system
help to clarify and focus on important aspects
Remembering all of the details Models are a
way of storing information for later use in a
form that can be digested (e.g. a can say a
lot) Communicating with other development team
members Support communication e.g. someone
working on inputs and outputs can use the model
to communicate with someone working on processing
details Communicating with a variety of users
and stakeholders Reviewing the models with
the users helps to get feedback Users need
to see clear and complete models to understand
what the analyst is proposing Users often
work with analyst to create models (this process
can help users better understand what the system
can do)
4
The requirements models are used as
documentation for future maintenance or
enhancement the system It is critical for
development team to leave behind a clear record
of what was created Need to package
everything in a form future developers can
understand and use when they modify and update
the system Much of the documentation
consists of models along with the textual reports
Figure 5-1 summarizes the reasons for modeling.
FIGURE 5-1 Reasons for modeling.
5
Types of Models Many types of models are used
when developing information system. The type of
model depends on the nature of information being
represented. Types of models include mathematical
models, descriptive models and graphical
models. A mathematical model is a series of
formulas that describe technical aspects of a
system They are most natural for scientific
or engineering applications Sometimes are
used in business systems e.g. simple formula
for payroll where you model gross pay as regular
pay plus overtime pay A descriptive model is
narrative memos, reports, or lists that describe
some aspect of the system which cannot be
precisely defined with mathematics (see Figure
5-2 as an example of descriptive models)
Initial interviews with users might require the
analysts to jot down notes in a narrative form
Users may describe what they do in reports or
memos Analyst can then convert these
descriptions to a modeling notation Sometimes
narratives are best way to record information
Simple lists of features, inputs, outputs, events
or users are examples of this kind of models
6
FIGURE 5-2 Some descriptive models.
7
A very important form of narrative model
writing a procedure in a very precise way
structured English or pseudocode Pseudocode is
used a lot by programmers, can also be used to
describe procedures during earlier phases of
SDLC Example of Pseudocode description of a
payroll function 1. Input the employees payroll
data 2. If hours worked is greater than 40 then
calculate overtime pay 3. Calculate gross pay
for the employee Gross Pay hourly pay times 40
plus overtime 4. Calculate tax for the employee,
etc. Graphical models are the most useful
models created by the analyst. They include
diagrams and schematic representations of some
aspect of a system Make it easier to
understand complex relationships that are too
difficult to follow when described verbally (old
saying a picture is worth a thousand words)
Graphical models may look similar to a real-world
part of the system (e.g. a screen design or
report layout) But often represent more
abstract things, e.g. processes, data, objects,
messages, connections
8
Key graphical models tend to represent
abstract aspects of a system during the analysis
phase The more concrete models (e.g. screen
design) tend to appear later in the design phase
Notes on graphical models Many different types
and formats Variations in notation However,
still based on basic symbols Circle
Square Rectangle Line and so
on Models used in the Analysis Phase The
analysis phase named Define System Requirements
involves creating a variety of models These are
logical models (define what is required without
committing to one specific technology) Many
different types of formalisms for defining
logical models Figure 5-3 lists some of the
commonly used models.
9
FIGURE 5-3 Models created during the analysis
phase.
10
Models used in the Design Phase These are
physical models since they show how some
aspects of the system will be implemented with a
specific technology Some of the models are
extensions of requirements models created during
systems analysis Some may be used during both
analysis and design (e.g. object-oriented class
diagram) Figure 5-4 represents some models used
during design phase.
FIGURE 5-4 Models created during the design phase.
11
II. Events and System Requirements All
approached to system development use two key
concepts to modeling processes Events
Things An event is an occurrence at a
specific time and place, that can be described
and is worth remembering. Events drive or trigger
all processes that a system does. E.g.
customer placing an order, shipping identifies a
backorder, nuclear reactor goes to meltdown
When defining system requirements it is useful to
begin by asking what events occur that will
affect the system being studied What
events will occur that the system will have to
respond to? It allows you to focus on
external environment to keep you at high level
view of system (as a black box) It also
allows you to focus on the interfaces of the
system to outside people and systems End
users can easily describe system needs in terms
of events that affect their work, so useful when
working with users Gives a way to divide
(or decompose) the system requirements so you can
study each separately (complex systems need to be
decomposed based on events) - see Figure 5-5
12
FIGURE 5-5 Events affecting a system.
13
The Background to Event Concept Structured
analysis first adapted the concept of events to
real-time systems in the early 1980s.
Real-time systems (e.g. process control system,
reactors, aerospace etc.) require the system
react immediately to events in the environment
(events like chemical vat is full, boiler
overflowing) The concept did not find
application to business system at that time, but
had been used in technical systems Now the
concept extended to business applications since
they have become more interactive (can be thought
of as a real-time systems) Information
engineering approach now uses it Very
important in object-oriented approach Types of
Events There are tree types of events external
events, temporal events, and state
events External Event is an event that occurs
outside the system Usually initiated by an
external agent or actor (a person or organization
that supplies or receives data from the system)
Classic example of an external agent is a
customer (event might be that the customer wants
to place an order)
14
Naming events Include the external agent in
the name (e.g. events Customer places order,
Management checks order status, Customer
reports change of address) External Events
Checklist helps in identifying the external
events External agent wants something
resulting in a transaction External agent
wants some information Data changed needs
to be updated Management wants some
information Temporal events is an event that
occurs as a result of reaching a point in time
(e.g. Payroll systems produce a paycheck every
two weeks or once a month or reports to
management generated regularly) System
automatically produces reports etc. at right time
(so no external agent needed) E.g.
temporal event Time to send late payment notice
(timed as event 15 days after billing date) An
analyst identifies temporal events by asking
about the specific deadlines tat the system must
accommodate
15
Temporal Events Checklist helps in identifying
the temporal events. It includes
Internal outputs needed Management
reports (summary or exception)
Operational reports (detailed transactions)
Statements, status reports (including
payroll) External outputs needed
Statements, status reports, bills,
reminders Temporal Events do not have to
occur on a fixed date (e.g. after a defined
period of time has elapsed). The temporal event
time to send late notice may occur 15 days
after the billing date. State Event is an event
that occurs when something happens inside the
system that triggers the need for processing
(e.g. the sale of a product results in an
adjustment in the inventory - event Reorder
point reached) Often occurs as a sequence of
external events Sometimes they are similar to
temporal events, but the point in time cant be
defined
16
Identifying Events It is not always easy to
define the events that affect a system. Some
helpful ideas involve Events versus conditions
and responses It can be difficult to
distinguish between an event and the sequence of
conditions that lead to it (e.g. sequence of
actions leading to buying a shirt see Figure
5-6)
FIGURE 5-6 Sequence of actions that lead up to an
event effecting the system.
17
Also it may be hard to distinguish between an
external event and the systems response (e.g.
customer buys the shirt, system requests credit
card number, the customer supplies the credit
card is not an event for the information
system, but just a part of interaction that
occurs while completing the original transaction,
i.e. the customer buying the shirt which is the
real event) Way to determine whether an
occurrence is an event Ask whether any long
pauses or intervals occur (i.e. can the system
transaction be completed without interruption?
Or, is the system at rest again waiting for
another transaction? Once a transaction starts
there are no significant stops till it is done.
The Sequence of Events Tracing a Transactions
Life Cycle It is often useful in identifying
events to trace the sequence of events for a
specific external agent or actor For Rocky
Mountain Outfitters example, the analyst must
think of all the possible transactions resulting
from one new customer (see Figure 5-7)
Customer wants a catalog Customer asks
for information about availability
Customer places an order Customer
wants to check status of an order
Customer wants to change his/her address
Customer may want to return an item
18
FIGURE 5-7 The sequence of transactions for one
specific customer.
19
Technology-Dependent Events and System
Controls The analyst should think about events
that are important to the system but not concern
directly users or transactions (e.g. design of
system controls) System controls are checks
or safety procedures put in place to protect the
integrity of the system. For example
Logging on to a system (for security reasons)
Controls for keeping integrity of a
database (e.g. backing up the data every day)
Controls are added to the system during design
but should not be considered during analysis (it
adds to the requirements details that the users
are not typically very concerned about) To
help decide which events apply to controls we
assume that technology is perfect (never the
case!) The perfect technology assumption states
that During analysis we should focus on
events that the system would be required to
respond under perfect conditions, i.e. with
equipment never breaking down, capacity for
processing and storage being unlimited and people
operating the system being completely honest and
never making mistakes. Assuming the perfect
technology (e.g. the disk will never crash), the
analysts can eliminate events like Time to back
up the database. During design phase we
deal with these issues and events from a
non-perfect world point of view, e.g. events
like Time to back up the database and add these
controls (Figure 5-8 lists some of events that
can be deferred until the design phase).
20
FIGURE 5-8 Events deferred until the design phase.
21
External Events for the Rocky Mountain Outfitters
Customer Support System The RMO customer
support system involves a variety of events. A
list of external events is shown in Figure 5-9.
FIGURE 5-9 External events for the RMO CSS.
22
Some of them involve customer - Customer
wants to check on item availability -
Customer places an order - Customer changes
or cancels order - Customer or management
wants to check order status - Customer
returns item - Customer updates account
information Other external events involve RMO
departments - Shipping fulfills orders
- Shipping identifies back order - Marketing
wants to send promotional materials to customers
- Management adjusts customer charges
(corrects errors) - Merchandising updates
catalog - Merchandising creates special
product promotion - Merchandising creates
new catalog The analyst can develop this list by
looking at all the people and organizations that
want the system to do something for them
23
Temporal Events for the RMO Customer Support
System The analyst can develop the list of
temporal events by looking at all the regular
reports and statements that the system must
produce at certain times (see Figure 5-10). Many
of them produce periodic reports for
organizational units Time to produce order
summary reports Time to produce transaction
summary reports Time to produce fulfillment
summary reports
FIGURE 5-10 Temporal events for the RMO CSS.
24
Looking at Each Event While developing the list
of events, the analyst should enter in the event
table additional information about each event for
later use. An event table represents events and
their details each row contains information
about one event, each column represents a key
piece of information about the event (see Figure
5-11 showing the information about an event
Customer wants to check item available).
FIGURE 5-11 Information about each event in an
event table.
25
Each event is characterized by The trigger an
occurrence that tells the system that an event
has occurred (either the arrival of data needing
processing or of a point in time) E.g. a customer
places an order, the new order detail are
provided as input The source an external agent
or actor that supplies data to the system The
activity behavior that the system performs when
an event occurs (the systems reaction) The
response an output, produced by the system that
goes to a destination The destination an
external agent or actor that receives data from
the system Figure 5-12 shows the event table for
the RMO CSS.
26
(No Transcript)
27
FIGURE 5-12 The complete event table for the RMO
CSS.
28
III. Things and System Requirements Another key
concept used to define system requirements
involves understanding and modeling things that
the system needs to store information about (e.g.
products, orders, invoices, customers, etc). In
traditional approach, these things make up the
data, about which the system stores information
(the type of data that need to be stored is
definitely a key aspect of the requirements for
any information system) In the object-oriented
approach these things are the objects that
interact in the system In either approach,
identifying and understanding these things are
both key initial step Types of Things As with
events, an analyst should ask the users to
discuss the types of things that they work with.
Different types of things are important to
different users, so it is important to include
information from all types of users. Figure 5-13
shows some types of things.
FIGURE 5-13 Types of things.
29
Tangible things are the most obvious (e.g.
airplane, book, vehicle, document, worksheet)
Roles played are another common type of things in
an information system (e.g. a role played by a
person, such as employee, customer, doctor or
patient, end user) Organizational units may
include organizational parts (e.g. division,
department, section, task force, work group)
Devices E.g. sensor, timer, controller, printer,
disk drive Incidents, events, or interactions
can be considered as the things (e.g. information
about an order, a service call, a contract, or an
airplane flight an order is a relationship
between a customer and an item of inventory)
Sites/locations (e.g. a warehouse, a store, a
branch office) A way to identify things of
interest The analyst can identify types of
things by thinking about each event in the event
list and asking what types of things are affected
that the system needs to know about, e.g. when a
customer places an order we need to know about
the following The customer The items
ordered Details about the order (e.g. date and
payment terms)
30
Relationships among Things There are many
important relationships among things in the
system. Relationship is a naturally occurring
association among specific things (e.g. an order
is placed by a customer, and an employee works in
a department see Figure 5-14)
FIGURE 5-14 Relationships between things.
Is placed by and works in are two relationships
that naturally occur between specific things
31
ISs need to store information about employees
and about departments, but equally important is
storing information about the specific
relationships (e.g. John works in the accounting
department, Mary works in the marketing
department or Order 1043 was placed by John
Smith) Relationships between things apply in
two directions - A customer places an order
(one direction) - An order is placed by a
customer (other direction) It is important to
understand the relationships in both directions
(sometimes it might seem more important to record
the relationships in one direction than in
another one, e.g. RMO needs to know what items a
customer ordered to prepare the shipment, but the
company needs to know all of the customers who
have ordered a particular item to notify all
customers who ordered a defective or recalled
product) It is important to know the nature of
each relationship in terms of the number of
associations of things, i.e. cardinality of the
relationship (e.g. a customer might place many
orders, but an order is placed by only one
customer). Cardinality means the number of
associations that occur between specific things
(can be one to one, one to many) Cardinality is
established for each direction of the
relationship. Multiplicity is a synonym for
cardinality often used with the object-oriented
approach
32
Also may be important to know the range of
possible values of the cardinality (the minimum
and maximum cardinality). E.g. a customer might
not ever place one order (zero associations), or
place one order (one association) Figure 5-15
shows cardinality of relationships.
FIGURE 5-15 Cardinality of relationships.
In some cases, at least one association is
required (a mandatory as opposed to optional
relationships) A one-to-one relationship can
also be refined to include minimum and maximum
cardinality (e.g. the order is placed by one
customer it is impossible to have an order if
there is no customer (therefore, one is the
minimum cardinality, making the relationship
mandatory)
33
Binary relationship is a relationship between
two different types of things (e.g. between a
customer and an order) Unary (recursive)
relationship is a relationship between two things
of the same type (e.g. one person being married
to another person or one department reports to
another one) Ternary relationship is a
relationship between three different types of
things (e.g. one order associated with a specific
customer plus a specific sales representative)
n-ary relationship is a relationship between n
(any number) different types of things Attributes
of Things Most ISs store and use specific pieces
of information about each thing Attribute is
one piece of specific information about a thing
(e.g. a customer has a name, phone number, credit
limit etc each of these is an attribute of a
customer) The analyst has to identify the
attributes of each thing that the system needs to
store Identifier (or key) is an attribute that
uniquely identifies a thing (e.g. a persons
social insurance number, or an invoice or
transaction number) Compound attribute is an
attribute that contains a collection of related
attributes (e.g. a customer full name is made up
of first name, middle name, last name and
possibly nickname) The analyst might start out
by describing the most important attributes but
later add to the list (Figure 5-16 is an example
of attributes of a customer and values of
attributes for specific customer)
34
FIGURE 5-16 Attributes and values.
Data Entities and Objects Data entities are the
things the system needs to store information
about in the traditional approach to information
systems (entities are things like customers and
order) The data entities, the relationship
between data entities and the attributes of data
entities are modeled using an entity-relationship
diagram (ERD) Computer processes interact with
these data entities, creating them, updating
attribute values and associating one with
another We can think about things as objects
that interact in the system
35
Objects in the work environment of the user
(called also problem domain) in the
object-oriented approach are often similar to
data entities in the traditional approach The
main difference the objects do the work in the
system, but do not just store information (i.e.
they have behavior as well as attributes) Figure
5-17 compares the traditional and object-oriented
views of data and objects
FIGURE 5-17 Data entities compared to objects.
36
This difference has important effects on system
modeling With the object-oriented approach,
each specific thing is an object (John, Mary,
Bill) and the type of thing is called class (in
this case, customer) Objects Revisited Class
is the type or classification to which all
similar objects belong (e.g. guitar and violin
objects both belong to class stringed
instruments) Classes, associations among
classes and attributes of classes are modeled
using a class diagram The class diagram shows
some of the behaviors of objects of the class,
called method Methods of a class are the
behaviors all objects in the class are capable to
do. A behavior is an action that the object
processes itself, when asked to do so by sending
it a message from another object Since each
object contains values for attributes and methods
for operating on those attributes (plus other
behaviors), an object is said to be encapsulated
(i.e. a self-contained and protected unit)
37
IV. The Entity-Relationship Diagram The
traditional approach to system development (the
structured techniques and information
engineering) pays significant attention to data
storage requirements for the new system Data
storage requirements include the data entities,
their attributes and the relationships among the
data entities. The model used to define the
data storage requirements is called the
entity-relationship diagram (ERD) ERD
Notation Rectangles represent data entities
Lines connecting rectangles show relationships
among data entities Figure 5-18 shows an example
of ERD with two data entities (Customer and
Order)
38
FIGURE 5-18 A simple ERD.
FIGURE 5-19 Cardinality symbols of relationships.
Each Customer can place many Orders (one to
many cardinality) Each Order is placed by one
Customer (one to one cardinality) Symbols on
the relationship line also represent the minimum
and maximum constrains (Figure 5-19 gives an
explanation). The model in Figure 5-18 says that
a Customer places a minimum of zero and a maximum
of many Orders on the other hand, an Order must
be placed by exactly one Customer
39
Figure 5-20 expands the model by including the
order items (each order contains a minimum of one
and a maximum of many items). This example also
shows some of the attributes of each data entry
a customer has a customer number, a name, a
billing address and several phone numbers each
order has an order ID, order date, and so on
each order item has a quantity, price and
backorder status.
FIGURE 5-20 An expanded ERD with attributes
shown.
Figure 5-21 shows an example of actual data in
some transactions.
40
FIGURE 5-21 Customer, orders and order items.
41
As an analyst works on a model, the ERD gets
refined (e.g. analyzing many-to-many
relationships see Figure 5-22).
FIGURE 5-22 A university course enrollment ERD
with a many-to-many relationship.
Courses are offered as course sections, and a
student enrolls in many course sections. Each
course section contains many students (the
relationship between course section and student
is many-to-many modeled with crows feet on
both ends of the relationships).
42
To avoid many-to-many relationship, we should
consider the grade each student receives for the
course stored. Adding a data entity Course
enrollment with an attribute Grade creates the
relationship between student and course section
(called an associative entity see Figure 5-23).
FIGURE 5-23 A refined university course
enrollment ERD with an associative entity.
43
The RMO CASE ERD Figure 5-24shows ERD diagram
for RMO CSS.
FIGURE 5-24 The RMOs CSS ERD without attributes
shown.
44
Each customer can place zero or more
orders Each order can have one or more
order items Each order item is for specific
inventory item Each inventory item is
associated with a product item that describes the
item generally(vendor, description, season,
normal price, special price) Each product
item is contained in one or more catalogs
The catalog offers packages (shirt, pains and
belt) at a reduced price. A package
contains product items A catalog contains
zero or more packages (an optional relationship),
but a package must include at least one product
item (a mandatory relationship) Each order
item is part of a shipment A shipment may
contain many order items Each shipment is
shipped by one shipper Each order
associated with one or more order transactions
(An order transaction is a record of a payment or
a return for the order. One order transaction is
created when the customer initially pays for the
order, the customer might return an item,
requiring a refund and another transaction)
45
V. The Class Diagram Object-oriented approach
models classes of objects instead of data
entities Classes have attributes and
associations (like entities) Classes also
have cardinality Main difference Objects do
the actual processing in a system (along with
storing) because objects have methods as well as
attributes More Complex Issues about Classes of
Objects Object oriented approach also has some
additional features Generalization/speciali
zation hierarchies Inheritance
Aggregation Generalization/Specialization
Hierarchies This concept is based on the idea
that people classify things in terms of
similarities and differences. Hierarchies that
structure or rank classes from the more general
superclass to the more specialized subclasses
sometimes called inheritance hierarchies
46
Generalization means grouping similar types of
things (e.g. motor vehicles group cars, trucks
and tanks. They share certain general features
(e.g. wheels, engine etc.), so motor vehicle is a
more general class) Specializations are
judgments that categorize different types of
things (e.g. sports car is a special type of
car) A generalization/specialization hierarchy
is used to structure (or rank) things from the
more general down to the more special Each
class has a more general class above it a
superclass A class may have a more specialized
class below a subclass Figure 5-25 shows
generalization/specialization hierarchy for motor
vehicle. Figure 5-26 shows generalization/special
ization hierarchy for orders in RMO CSS.
47
FIGURE 5-25 A generalization/specialization
hierarchy for motor vehicles.
48
FIGURE 5-26 A generalization/specialization
hierarchy for orders.
49
Inheritance Inheritance is a concept that
allows subclasses to share characteristics of
their superclasses E.g. a sports car has
everything a car has (e.g. 4 wheels and an
engine, which it inherits from the class car
which is above it Figure 5-25) The sports
car then specializes E.g. has a sports
option, racing wheels etc. In the
object-oriented approach, inheritance is a key
concept that is possible because of
generalization/specialization hierarchies (these
hierarchies are often called inheritance
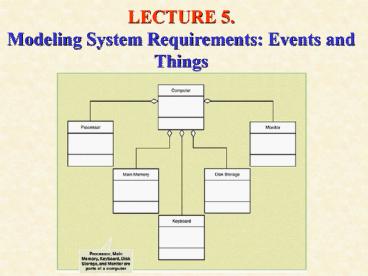
hierarchies) Aggregation (Whole-Part
Hierarchies) Another way to structure things is
by defining them in terms of their parts
Aggregation is a relationship between an object
and its parts E.g. aggregation in the context
of a computer system, a computer system is made
up of Processor, main memory,
keyboard, disk storage, monitor Each of
these may be an object themselves Figure 5-27
demonstrates the concept of aggregation in a
computer system (diamond symbol represents
aggregation)
50
FIGURE 5-27 Aggregation or whole-part
relationships.
51
Examples of Class Diagram Notation Class
diagram is a model to show classes of objects
The notation is based on Unified Modeling
Language (UML), which has become the de facto
standard for models used with object-oriented
system development Figure 5-28 shows an example
for class Customer The class symbol is a
rectangle The top section of the rectangle is
the name of the class The middle section is the
attributes of the class The bottom section
lists the methods of the class (methods define
the behavior of objects of the class). Methods
are not always shown as far as they are standard.
FIGURE 5-28 The class symbol for the class
diagram.
52
Example Class Diagram (Figure 5-29) Bank
account system includes a generalization/specializ
ation hierarchy Account is the
superclass Savings Account and Checking
Account are subclasses of Account A
triangle on the line connecting classes indicates
inheritance (the subclasses inherit attributes
and behaviors from the superclass Account things
like having an account number) But savings and
checking accounts are also specialized A
savings account knows how to calculate interest
but a checking account doesnt (so they have
different methods and attributes, although they
share things they inherit from class Account)
The Customer class and the Account class are
associated Each customer can have zero or
more accounts (the diagram shows the minimum and
maximum cardinality on the line connecting the
classes, and the asterisk means many
Each account is owned by one and only one
customer
53
FIGURE 5-29 The class symbol for the class
diagram.
54
The RMO CASE Class Diagram The class diagram
for RMO is shown in Figure 5-30. It is very
similar to the entity-relationship diagram in
Figure 5-24 A generalization/specialization
hierarchy is included to show three types of
orders web order, telephone order and mail
order, which share the attributer listed for
Order, but each special type of order has some
additional attributes This diagrams shows no
methods The initial class diagram developed
during the systems analysis phase includes no
methods. As behaviors of objects are further
developed (during analysis and design) methods
are added. Shipper class knows (has methods)
how to create a new shipper object, delete a
shipper object, change a name or address and
connect to a specific shipment.
55
FIGURE 5-30 The RMO class diagram.
56
Differences Between Traditional and
Object-Oriented The requirements models are
quite different depending on approach used by the
team traditional or object-oriented (the two key
concepts events and things see Figure 5-31)
Traditional approach based on the event table
creates a set of data flow diagrams (DFDs) the
entity-relationship diagram (ERD) defines the
data storage requirements that are included in
the DFDs, views a system as a collection of
processes. When the process executes it interacts
with data. So, emphasizes processes, data,
input/outputs Object Oriented approach based
on the event table creates class diagrams, views
a system as a collection of interacting objects
with their own behavior (methods). There are NO
conventional processes and data files, just
interacting objects
57
FIGURE 5-31 Requirements models for the
traditional approach and OO approach.
58
Readings
Todays lecture Chapter 5 Modeling System
Requirements Events and Things For next
lecture Chapter 6 The Traditional Approach to
Requirements
Recommended
CrystalGraphics Presentations


