
Arsenic in Drinking Water in Taiwan* - PowerPoint PPT Presentation
1 / 27
Title:
Arsenic in Drinking Water in Taiwan*
Description:
pocket dosimeter. Monitors For Exposure / Dose. Thermal Stress. PHYSICAL ENVIRONMENT ... Personal noise dosimeter. time-integrated dose. Noise-intensity analyzer ... – PowerPoint PPT presentation
Number of Views:56
Avg rating:3.0/5.0
Title: Arsenic in Drinking Water in Taiwan*
1
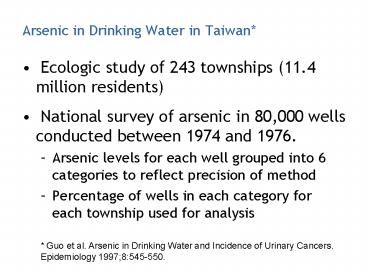
Arsenic in Drinking Water in Taiwan
- Ecologic study of 243 townships (11.4 million
residents) - National survey of arsenic in 80,000 wells
conducted between 1974 and 1976. - Arsenic levels for each well grouped into 6
categories to reflect precision of method - Percentage of wells in each category for each
township used for analysis
Guo et al. Arsenic in Drinking Water and
Incidence of Urinary Cancers. Epidemiology
19978545-550.
2
Drinking Water Turbidity in PhiladelphiaMeasurem
ent Surrogates for Exposure
- Ecologic study Childrens hospital visits for
Gastrointestinal Illness in Philadelphia - Turbidity for 5 years (1989-1993)
- Collected to meet EPA requirements
- A surrogate for microbial contamination and
effectiveness of water treatment - Daily mean from 3 water treatment plants serving
different areas - Time series analysis adjusted for season,
temperature day-of-week with lagged exposure
Schwartz et al. Drinking Water Turbidity and
Pediatric Hospital Use for Gastrointestinal
Illness in Philadelphia, Epidemiology
19978615-620.
3
Proximity to Hazardous Waste SitesGeographic
Surrogates for Exposure
- Population mothers of birth defect cases and
controls in California - Residential histories during periconceptual
period - Location of 764 hazardous waste sites identified
- 105 National Priority List sites identified
information on site-related contamination
collected (media contaminated, chemicals,
clean-up, etc) - Census tract, latitude/longitude boundaries
identified - Analysis census tract residence within 1 mile
Croen et al. Maternal residential Proximity to
Hazardous Waste Sites and Risk for Selected
Congenital Malformations. Epidemiology
19978347-354.
4
Exposure Assessment Methods Protective (versus
Predictive) Assessments
- Protective assessments are designed for initial
investigations as a screening tool, and for
risk-based corrective actions. - General criterion is conservatism, e.g., use of
worst-case scenario for potential exposure and
risk. - Often estimates exposure to most-exposed
individual, MEI, a hypothetical individual. - Use of generic parameters
- Often criticized as overly conservative
- Protective exposure assumptions often used in
prospective risk assessments
Applications of exposure assessment
5
Conservative Assumptions
Hazardous waste site remediation
Lifetime air pollution exposure
6
Predictive Assessments
- Predictive assessments are designed to assess
actual exposure (risk) to population for use in
epidemiological, dose-response studies. - Uses reasonable case scenario, most likely
scenarios - Requires demographic information
- Requires site-specific parameters
A major difference exists between predictive and
protective assessments
7
Components of Environmental Exposure Assessment
- Determine and characterize source(s)
- Identify exposure pathway(s) environmental
fate - Estimate concentration at human/environment
boundary - Perform integrated exposure analysis
- Identify exposed population
- Uncertainty analysis (throughout)
- Evaluate significance
Transport and transformation
Human contact exposure
Contaminant source emissions
Accumulation in environment
Potential dose to body
Internal dose
Early expression of disease
Health Effect
Biologically effective dose
8
Uncertainty analysis variability versus
uncertainty
- Uncertainty represents a lack of knowledge about
factors affecting exposure or risk, whereas
variability arises from true heterogeneity across
people, places, or time - Uncertainty can lead to inaccurate or biased
estimates, whereas variability can affect the
precision of the estimates and the degree to
which they can be generalized
9
Evaluation of significance of estimated exposures
1. Comparison to Exposure Limits Consensus,
regulatory, and/or guideline levels are available
for many agents. Occupational standards (all
for airborne contaminants) ACGIH TLVs OSHA
PELs NIOSH RELs, IDLH Community
standards EPA NAAQS (ambient air
contaminants) FDA ADI (food contaminants) EPA
MCLs (drinking water contaminants) WHO
guidelines (various media)
2. Estimation of Individual and Population Risks
Risk Assessment
10
Chemical And Biological Contaminants In Workplace
Air
11
Similarly Exposed Group (SEG) Of Workers
- . . . A GROUP OF WORKERS DEFINED BY THE
EXPECTATION THAT, ON AVERAGE, THEY WILL BE
EXPOSED TO THE SAME CONTAMINANT COMING FROM THE
SAME SOURCES.
12
Variability Of Exposure
OEL
MEDIAN
LOG-NORMAL DISTRIBUTION
FREQUENCY
TWA EXPOSURE INTENSITY FOR THE SEG STUDIED
13
Technical Methods For Air Sampling In Workplaces
- FIXED POINT, STATIC or AREA SAMPLING now mostly
absent in developed countries (with notable
exceptions). - PERSONAL SAMPLING NOW CONSIDERED TO BE THE
NORM small personal sampling devices worn on
the lapel or jacket in the breathing zone.
14
The IOM Personal Inhalable Aerosol Sampler
15
The Photoionization Real-time Detector For
Organic Vapors
16
Ionizing Radiation Concept Of Radiation Dose
- DOSE the quantity of radiation energy absorbed
by a given mass. - SIEVERT (Sv) the amount of absorbed radiation,
weighted according to the biological
effectiveness of the radiation
17
Typical Radiation Exposures
- Radiologists (X and ? ) 0.7 mSv/year
- Flight crews (X and ? ) 1.7 mSv/year
- Nuclear power plant workers (PWR) (? ) 4.9
mSv/year - Dentists (X) 0.7 mSv/year
- Nuclear power plant workers (PWR) (neutron) 0.5
mSv/year - Uranium mining (? ) 11 mSv/year
- (Note OEL 50 mSv/year)
18
Monitors For Exposure / Dose
- Activity ratemeters-
- ionization chambers.
- Geiger-Mueller counters, etc.
- scintillation counters.
- Personal dosimeters-
- film badge (amount of darkening dose).
- pocket dosimeter.
19
Thermal Stress
- PHYSICAL ENVIRONMENT
- temperature
- humidity
- ambient wind
- work rate
- HUMAN ENVIRONMENT
- work rate
- heart rate
- oral temperature
- level of hydration
20
Noise
- The physical intensity of sound or noise is
expressed in units of sound pressure level. - But the decibel (dB) scale is used to contract
(logarithmically) the range of numbers we would
have to measure.
21
Measurement of Noise
- Sound level meter (SLM)
- instantaneous dBA (or dBC) levels
- Personal noise dosimeter
- time-integrated dose
- Noise-intensity analyzer
- magnitude and direction of noise
- Narrow-band analyzer
- to investigate noise sources, to indicate
frequency content
22
Vibration
- PROPERTIES
- displacement
- velocity
- acceleration
- resonance
- MEASUREMENT
- accelerometers (piezoelectric) to measure
acceleration in both magnitude and direction
23
Injury Exposure To Risk Of Accidents By Truck
Drivers
- Technical factors (technical review)
- type of vehicle
- hours driven
- seasonal
- geographical, etc.
- Human factors (questionnaire)
- education and training
- personality
- state of health
- experience, etc.
24
Injury Exposure To Risk Of Repetitive Strain
Injury
- Technical factors (technical review)
- exposure situation
- hours exposed
- exposure frequency
- Human factors (questionnaire)-
- education and training
- personality
- state of health
25
Other Exposures . . . .
- SPECIAL PROBLEMS IN ASSESSING EXPOSURES
THROUGH THE DERMAL AND INGESTION ROUTES
- WHAT ARE RELEVANT INDICES OF EXPOSURE?
26
Retrospective Exposure Assessment
- . . . . . LOOKING BACKWARDS SO WE CAN PREDICT
FORWARDS
27
Rationale
- To re-construct past exposures
- to provide more complete exposure histories in
order to better perform epidemiologic studies for
environment-related diseases that have very long
time scales (e.g., some cancers).