
GDP per Capita: Highest - PowerPoint PPT Presentation
Title:
GDP per Capita: Highest
Description:
... 3.5 billion entering the modern world economy Tallest Buildings in the world today The Future A Long Way to Go Poverty in India Fastest Growing Economies ... – PowerPoint PPT presentation
Number of Views:447
Avg rating:3.0/5.0
Title: GDP per Capita: Highest
1
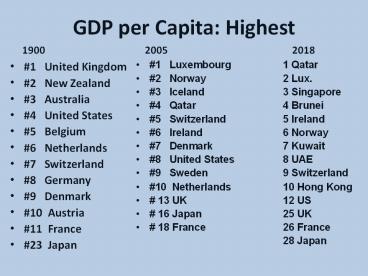
GDP per Capita Highest
- 1900
- 2005 2018
- 1 United Kingdom
- 2 New Zealand
- 3 Australia
- 4 United States
- 5 Belgium
- 6 Netherlands
- 7 Switzerland
- 8 Germany
- 9 Denmark
- 10 Austria
- 11 France
- 23 Japan
- 1 Luxembourg 1 Qatar
- 2 Norway 2 Lux.
- 3 Iceland 3 Singapore
- 4 Qatar 4 Brunei
- 5 Switzerland 5 Ireland
- 6 Ireland 6 Norway
- 7 Denmark 7 Kuwait
- 8 United States 8 UAE
- 9 Sweden 9 Switzerland
- 10 Netherlands 10 Hong Kong
- 13 UK 12 US
- 16 Japan 25 UK
- 18 France 26 France
- 28 Japan
2
Developing World
- South
- LDCs
- Third World
- Latin America
- Asia
- Africa
3
Western Hemisphere Colonized(current borders
included)
4
Colonized Africa
5
Colonized Asia 1910
6
Middle East Colonized (roughly WWI)
http//www.npr.org/news/specials/mideast/the_west/
colonies_map.html
7
Independence
- Latin America (by 1823)
- Middle East (after WW I)
- Africa and Asia (post-WW II)
8
Strategies for Development
- Modernization Be like the west
- Nationalization Seize assets of wealthy nations
in a developing nation (related to Dependency
theory) - Marxism Use Soviet Union as a model
- East Asian Strategy Accept globalization
integrate with the world economy, but on their
own terms, not complete integration - State Capitalism Government ownership and deep
intervention in business with goal to build
industries and make money
9
1. Modernization The Dilemma The Flow of Money
- cars, computers, manufactured goods
- bananas, coffee, timber, minerals
EDCs
LDCs
10
Treat as Reading Assignment
- Developed Economically Developed Countries (EDCs)
- Developing Less Developed Countries (LDCs)
- North America, Western Europe, Japan
- Large middle class
- High Tech
- Industrial products
- High skills
- High wages
- Cars, chemicals, aerospace, telecomm,
electronics, software
- Africa, Asia, Middle east, Latin America
- Primary products
- Commodities
- Elites -- impoverished
- Low skills
- Low wages
- Bananas, coffee, minerals, rubber, timber
11
2. Nationalization Dilemma
- Global Wealth ranking by GDP per capita
- (for nations following Nationalization strategies
after WW II) - 1900 1950 2005
- Argentina 12 12 31
- Chile 16 16 53
- Mexico 22 27 57
- Colombia 25 26 76
- Venezuela 27 4 84
- (data from Nation Master.Com http//www.nationma
ster.com/index.php)
12
DebtProblem of Modernization and Nationalization
- Getting debt relief with conditions (by 2000s)
Benin, Bolivia, Burkina Faso, Cameroon, Ethiopia,
Ghana, Guyana, Honduras, Madagascar, Malawi,
Mali, Mauritania, Mozambique, Nicaragua, Niger,
Rwanda, Sao Tome and Principe, Senegal, Sierra
Leone, Tanzania, Uganda, and Zambia. - Receiving debt relief and deciding on conditions
Afghanistan, Burundi, Chad, the Democratic
Republic of the Congo, the Republic of Congo, the
Gambia, Guinea, Guinea-Bissau, and Haiti. - Eligible for debt relief Central African
Republic, Comoros, Côte dIvoire, Eritrea, the
Kyrgyz Republic, Liberia, Nepal, Somalia, Sudan,
and Togo.
13
3. Marxism
- Clockwise from the top Statue of Kim
Il-sung, North Korean leader from 1948-1994
skulls left by the Khmer Rouge, in power in
Cambodia from 1975-1978 Fidel Castro,
dictator of Cuba, 1959-2016
14
4. East Asian Strategy(see the other PPT for
details reference only)
- Liberalism and Nationalism Mixture
- Japan as the Model
- Business-Government Partnership
- Open up the Economy to Foreign Investment
- Exports!
- Protect key industries
15
Four Tigers
- Hong Kong Singapore
- South Korea Taiwan
16
Tokyo 1945
17
Tokyo 50-60 Years later
18
Seoul, ROK
19
Singapore
20
Taipei, Taiwan
21
Hong Kong, China
22
Integrating into the World Economy
- Parts
- Unfinished imports exports
- products Finished
- Components products
Export Processing Zone
23
5. State Capitalism
- China 1978
- Deng Xiaoping
24
State Owned Enterprises (SOEs)
- Problems
- Deeply in Debt
- Corruption
- Losing Money
25
Developing World Growing, butWho is left out?
- Nations in civil war
- Land locked
- Low technology (rich or poor nations)
- Climate problems
- Health crises
26
Current Trends
- Massive Economic Growth led by China, India, East
Asia, then Africa
27
2. Globalization Success of Liberal Order
- Free Trade Agreements
- European Union 1991
- NAFTA 1993
- ASEAN FTA 1993
- Common Market for Eastern and Southern Africa
1994 - South Asia Free Trade Agreement 2004
28
More FTAs, But then again
- Trans Pacific Partnership (TPP) 2016
- Comprehensive and Progressive for Trans Pacific
Partnership (CPTPP) 2018
29
3. Rising Inequality
- Wealth upper income
- middle income
- poor
- Time
30
4. Backlash in Developed World
- Shift from Older industrial Decline in
- Industrial era Economies Traditional
- To Digital era Reluctance/Inability Industri
al to Change Sectors - (mining or manufacturing)
- Established Parties
- offer nothing new
- Rejection Birth of New of
Established Parties or - Policy Consensus New Movements
- within Established
- Parties
31
Backlash in Developed World
- US moving toward nationalism
- Economic Nationalism spreading
- Xenophobia on right
- Anti-globalization and socialism on left
Recommended
CrystalGraphics Presentations


