
Global Fishing Issues - PowerPoint PPT Presentation
Title:
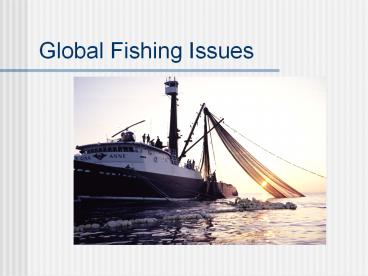
Global Fishing Issues
Description:
Global Fishing Issues Organization 1. Introduction 2. Trends in World Fisheries and Their Resources: 1974-1999 3. Fisheries Impact on Ecosystems and Biodiversity 4. – PowerPoint PPT presentation
Number of Views:530
Avg rating:3.0/5.0
Title: Global Fishing Issues
1
Global Fishing Issues
2
Organization
- 1. Introduction
- 2. Trends in World Fisheries and Their Resources
1974-1999 - 3. Fisheries Impact on Ecosystems and
Biodiversity - 4. Aquaculture
- 5. Root Causes of Problem
- 6. Comprehensive Conservation and Management
3
1. Introduction and Organization
- Fundamental Global Fisheries Problems of
- 1. Excess fishing capacity
- 2. Degraded and overexploited ecosystems
- 3. Overfished resource stocks
- Inter-related problems
- Different disciplines emphasize different aspects
- But multi-disciplinary and multi-pronged
approaches required - No single magic bullet solution
4
1. Introduction and Organization
- 1. Introduction and Organization
- 2. Trends in World Fisheries and Their
- Resources 1974-1999
- 3. Fisheries Impact on Ecosystems and
- Biodiversity
- 4. Aquaculture
- 5. Root Causes of Problem
- 6. Comprehensive Conservation and
- Management
5
2. Trends in World Fisheries and Their Resources
1974-1999
- Sources
- FAO Trends in World Fisheries and Their
Resources 1974-1999, in The State of World
Fisheries and Aquaculture, Part 3 - Pauly et al. Towards Sustainability in World
Fisheries, Nature, Vol. 418, 8 August, 2002, pp.
689-695 - Daniel Pauly, Villy Christensen, Johanne
Dalsgaard, Rainer Froese, Francisco Torres Jr.,
Fishing Down Marine Food Webs, Science,Vol.
279, February 6, 1998, pp. 860-863 - Technical Advisory Committee (TAC) Meeting on
Management of Tuna Fishing Capacity Conservation
and Socio-Economics, Madrid, March 14-18, 2004
6
- Big increases in effective fishing effort since
WWII - Increases in vessel numbers and sizes
- Rapid technological advances
- Industrial-scale fishing
- Trawling, purse seining, long-lining
- Small-scale or artisanal
- Shallow tropical waters for food fish and shrimp
- Compete with industrial-scale shrimp trawlers
7
How large is the global capture fish market?
- Current FAO global figures for fiscal 2000
- 94.8 million tonnes landed globally
- First-sale value 81billion US
Source FAO SOFIA 2002 report (table 1).
8
Global landings slowly declining since late
1980s, by about 0.7 million tons per year (Pauly
et al.)
9
- Global consumption of seafood products has
doubled over the past 30 years, driven by
population growth and rising income levels. - The United States, European Union, and Japan are
the "Big Three" consumers for 80 of all seafood
traded internationally.
10
- In the past 35 years, the number of people
fishing in the world has doubled and most of the
growth has taken place in Asia due to the growth
of aquaculture and poor government enforcement of
restrictions on over-fishing.
11
- An annual average of 7.3 million tons of fish is
thrown back into the sea dead or dying because
they are damaged, of the wrong species, under the
legal landing size, or over a vessel's quota of
fish. - This figure is believed to underestimate the
number of marine mammals, turtles, and seabirds
also caught as by-catch.
12
- Aquaculture has become the fastest growing food
production sector in the world - Now accounts for over 30 of all fish consumed.
- Most of the increase has occurred in Asian
countries, with China producing 70 of the global
total of farmed fish.
13
- It takes up to 3 pounds of wild anchovies or
mackerel to feed and create 1 pound of farmed
salmon or shrimp.
14
- Based on 2000 estimates, ocean-related activities
directly contribute to more than 117 billion to
the American economy and support well over 2
million jobs, including maritime trade, offshore
oil and gas operations, and the fishing industry.
15
Global trends vis-à-vis MSY since 1974 (FAO)
- Percentage of stocks at MSY level slightly
decreased - Percentage of stocks exploited below MSY
decreased steadily - Percentage of stocks exploited beyond MSY has
increased - From about 10 in early 1970s to nearly 30 in
late 1990s - Many stocks without information
16
Global trends vis-à-vis MSY since 1974 (FAO)
17
Trends in percentage of stocks exploited beyond
MSY levels in North Atlantic and Pacific Oceans
18
Trends in percentage of stocks exploited beyond
MSY levels in North Atlantic and Pacific Oceans
- Increasing proportion of stocks exploited beyond
MSY until late 1980s or early 1990s - In North Atlantic, situation has improved and
stabilized in 1990s - In North Pacific, situation has remained unstable
19
Trends in percentage of stocks exploited beyond
MSY levels in tropical (Central and Southern)
Atlantic and Pacific Oceans
20
Trends in percentage of stocks exploited beyond
MSY levels in tropical (Central and Southern)
Atlantic and Pacific Oceans
- Growing percentage of stocks exploited beyond MSY
in both tropical oceans - Deteriorating situation, with possible exception
of tropical Atlantic, where stabilization might
have started
21
Status of Stocks in 1999 (FAO)
22
Status of Stocks in 1999 (FAO)
- In 1999, vis-à-vis MSY
- 4 of stocks underexploited
- 21 moderately exploited
- 47 fully exploited
- 18 overexploited
- 9 depleted
- 1 recovering
- In sum, 72 of stocks at or above MSY level
23
Myers and Worm (Nature 2003) claim that the
worlds oceans have lost over 90 of large
predatory fish as compared to their pre-1970s
levels.
FAO takes a much more conservative view, but
agrees that an increasing number of fisheries
are either fully exploited or over-exploited.
24
Fishing Down Food Webs
- The mean trophic level of the species groups
reported in Food and Agricultural Organization
global fisheries statistics declined from 1950 to
1994. - Globally, trophic levels of fisheries landings
appear to have declined in recent decades at a
rate of about 0.1 per decade, - This reflects a gradual transition in landings
from long-lived, high trophic level, piscivorous
bottom fish toward short-lived, low trophic level
invertebrates and planktivorous pelagic fish.
25
Fishing Down Food Webs
- This effect, also found to be occurring in inland
fisheries, is most pronounced in the Northern
Hemisphere. - Fishing down food webs (that is, at lower trophic
levels) leads at first to increasing catches,
then to a phase transition associated with
stagnating or declining catches. - These results indicate that present exploitation
patterns are unsustainable.
26
Status of Tuna Stocks (FAO)
27
(No Transcript)
28
Trends in the catch of the principal market
species of tunas by ocean
29
Trends in the world catch of tunas by species
30
Trends in the catch of tunas from the Pacific
Ocean
31
Abundance of Pacific Tunas
32
Trends in the catch of tunas from the Atlantic
Ocean
33
Trends in the world catch of bluefin tunas
34
Organization
- 1. Introduction and Organization
- 2. Trends in World Fisheries and Their Resources
1974-1999 - 3. Fisheries Impact on Ecosystems and
Biodiversity - 4. Aquaculture
- 5. Root Causes of Problem
- 6. Comprehensive Conservation and Management
35
3. Fisheries Impact on Ecosystems and Biodiversity
- Source Pauly et al.
36
Organization
- 1. Introduction and Organization
- 2. Trends in World Fisheries and Their Resources
1974-1999 - 3. Fisheries Impact on Ecosystems and
Biodiversity - 4. Aquaculture
- 5. Root Causes of Problem
- 6. Comprehensive Conservation and Management
37
4. Aquaculture
38
Organization
- 1. Introduction and Organization
- 2. Trends in World Fisheries and Their Resources
1974-1999 - 3. Fisheries Impact on Ecosystems and
Biodiversity - 4. Aquaculture
- 5. Root Causes of Problem
- 6. Comprehensive Conservation and Management
39
5. Root Causes of Problem
- 1. Expanding derived demand for resources and
increased productivity of exploitation - Ultimately, excessive population, advanced state
of technology for resource exploitation, and
demand for high standard of living - Until tackle these ultimate sources of high
derived demand for resources, will have
terrestrial and oceanic environmental problems - Are addressing symptoms in some sense
40
- 2. Ill-structured and incomplete property rights
- Open access
- Incomplete international institutions
- External costs and market failure
- Dont pay full economic costs of resource
exploitation - Including user cost of resource stocks
- Including ecosystem services
- Leads to excess capacity, ecosystem degradation,
overfishing
41
- Economic concepts of opportunity costs,
trade-offs, and all costs and benefits - Trade-offs between between oceanic and
terrestrial ecosystems for level of resource
exploitation and ecosystem health - No free lunch
- Opportunity cost to preserving oceans lies on
greater reliance on terrestrial ecosystems
42
- Monoculture, simplistic terrestrial food webs,
genetically modified foods, pesticides,
herbicides, chemical fertilizers to raise yields - Great grain-growing areas of world, like Great
Plains, have devastated ecosystems as bad
anything facing oceans - Human diets comprised more of plants and less of
animals - Eating lower on the terrestrial food chain to
reduce derived demands for resources
43
Organization
- 1. Introduction and Organization
- 2. Trends in World Fisheries and Their Resources
1974-1999 - 3. Fisheries Impact on Ecosystems and
Biodiversity - 4. Aquaculture
- 5. Root Causes of Problem
- 6. Comprehensive Conservation and Management
44
6. Comprehensive Conservation and Management
- No single answer for multi-faceted problem of
excess fishing capacity, ecosystem degradation,
and overfishing - Also case-by-case
45
- 1. Property rights when appropriate
- Individual or effective common property
- On catches, resource stocks, fishing effort, or
areas - Catches flows from resource stocks
- Areas TURFs in most developed form
- Largely developed countries
- More difficult with complex multispecies
fisheries - Critically difficult to apply in developing
countries - Enforcement and monitoring key problems
46
2. Strengthen international environmental
agreements for high seas and straddling stocks
- Problems derive from common stocks, which migrate
over expansive areas of the worlds seas - Strengthen the authority for regional tuna and
other international organizations - Give authority to deal with economic and social
issues - Including the authority to assume and assign
property rights in the fisheries - Establish permanent global body to coordinate
regional commissions
47
- Start management with limited entry
- Moratorium on fleet growth
- Must deal with new entrants (allowed under intl
law) - Strengthen management with annual vessel-level
catch limits - Assigned to individual vessels rather than to
flag states - Better if catch quotas are transferable property
right - Their purchase addresses new entrant issue
- Esp. coastal developing country nations
- Trade restrictions for compliance and enforcement
- Vessel decommissioning scheme
48
3. Limited access (entry) programs everywhere
there isnt effective property rights regime
- Highly attenuated property right
- Particularly exclusive use
- Especially developing countries
- Difficult to apply property rights approach
- Complex multispecies fisheries in tropics where
output controls and rights ineffective - Typically, combine with limits on one or more
inputs (e.g. vessel length)
49
4. Judicious use of vessel decomissioning and
buy-back programs
- In developed countries, more short- to
medium-term measure to restore profitability - People behave very differently when fishery is
profitable. - Rights-based systems are not possible (e.g.
number of players is too high) - When fishery (at industry level) is not
profitable due to excess capacity - Good supplement to marine protected areas
- In developing countries, more difficult to
implement
50
5. Taxes on fisheries to raise cost of fishing
and decrease input usage, fund management, vessel
buy-backs, etc.
- Opposite of subsidy
- Substitute for property rights solution in some
instances - Especially high seas, complex multispecies
fisheries, international trade
51
6. Eliminate external costs to make consumers and
producers bear full costs of consuming seafood
- Eliminate subsidies
- Taxes on both producers and consumers
- Incidence depends on elasticities (relative
strengths)
52
7. Comanagement
- Comanagement reshapes, the state interventions
so as to institutionalize collaboration between
administration and resource users and end those
unproductive situations where they are pitted
against one another as antagonistic actors in the
process of resource regulation. (Baland and
Platteau, p. 347) - Artisanal fisheries in developing countries
53
8. Judicious use of marine protected areas and
marine reserves
- Especially in critical habitats like spawning
areas, rookeries, nursery and pupping grounds,
coral reefs, beaches and nearshore for turtles,
etc. - Provide insurance scheme for resource stocks and
biodiversity - MPAs dont address ill-structured property rights
and excess capacity
54
8. Judicious use of marine protected areas and
marine reserves
- By themselves, MPAS tend to actually aggravate
excess capacity problem in remaining open areas - Have to couple with programs to reduce fishing
capacity - Controversy whether MPAs increase resource stock
sizes outside and by how much and which species
55
9. Technology standards
- Improved gear
- Reduce incidental mortalities and bycatch
- (e.g. TEDs and circle vs. J hooks for sea
turtles) - Reduce ecosystem degradation (e.g. trawl)
- Mesh sizes and designs for escapement
56
10. Eco-labeling, certified fisheries, trade
restrictions
- Useful in some instances
- More case-by-case basis
57
11. Small-Scale / Artisanal Fisheries
- Eliminate harmful harvesting practices
- Dynamite, cyanide
- Reserve nearshore fishing grounds and keep out
larger-scale - Less destructive gear (e.g. mesh sizes)
- Create employment opportunities outside of sector
58
11. Small-Scale / Artisanal Fisheries
- Create employment opportunities outside of sector
- Enhance value-added from post-harvesting
activities - Stop increasing investment and technological
change through aid programs, etc. - Increases fishing effort on resource stocks
already over-exploited
59
12. Judicious reliance on aquaculture
- Not panacea
- Primarily only economically feasible for
high-valued species - Derived demand for fish meal from fish species
lower down on food web - E.g. anchovies, sardines
60
- Recognize true opportunity costs, trade-offs, and
costs and benefits - Full costs include
- Ecosystem degradation for coastal shrimp
aquaculture in mangrove swamps - Genetic mixing with wild species (salmon)
- Diseases
- Seed stock and feed still primarily from wild
- Dont substitute aquacultured for wild species
- Even feeding salmon soybean meal simply shifts
problem to monoculture agriculture in degraded
terrestrial ecosystems