
Figure 16.0 Watson and Crick - PowerPoint PPT Presentation
Title: Figure 16.0 Watson and Crick
1
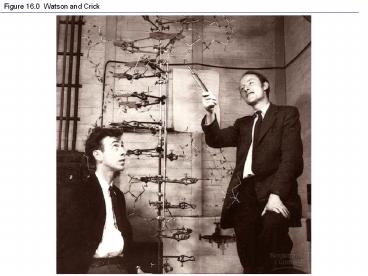
Figure 16.0 Watson and Crick
2
Figure 16.0x James Watson
3
Figure 16.1 Transformation of bacteria
4
Figure 16.2a The Hershey-Chase experiment phages
5
Figure 16.2ax Phages
6
Figure 16.2b The Hershey-Chase experiment
7
Figure 16.3 The structure of a DNA stand
8
Figure 16.4 Rosalind Franklin and her X-ray
diffraction photo of DNA
9
Figure 16.5 The double helix
10
Unnumbered Figure (page 292) Purine and pyridimine
11
Figure 16.6 Base pairing in DNA
12
Figure 16.7 A model for DNA replication the
basic concept (Layer 1)
13
Figure 16.7 A model for DNA replication the
basic concept (Layer 2)
14
Figure 16.7 A model for DNA replication the
basic concept (Layer 3)
15
Figure 16.7 A model for DNA replication the
basic concept (Layer 4)
16
Figure 16.8 Three alternative models of DNA
replication
17
Figure 16.9 The Meselson-Stahl experiment tested
three models of DNA replication (Layer 1)
18
Figure 16.9 The Meselson-Stahl experiment tested
three models of DNA replication (Layer 2)
19
Figure 16.9 The Meselson-Stahl experiment tested
three models of DNA replication (Layer 3)
20
Figure 16.9 The Meselson-Stahl experiment tested
three models of DNA replication (Layer 4)
21
Figure 16.10 Origins of replication in eukaryotes
22
Figure 16.11 Incorporation of a nucleotide into
a DNA strand
23
Figure 16.12 The two strands of DNA are
antiparallel
24
Figure 16.13 Synthesis of leading and lagging
strands during DNA replication
25
Figure 16.14 Priming DNA synthesis with RNA
26
Figure 16.15 The main proteins of DNA
replication and their functions
27
Figure 16.16 A summary of DNA replication
28
Figure 16.17 Nucleotide excision repair of DNA
damage
29
Figure 16.18 The end-replication problem
30
Figure 16.19a Telomeres and telomerase
Telomeres of mouse chromosomes
31
Figure 16.19b Telomeres and telomerase
32
Figure 17.0 Ribosome
33
Figure 17.1 Beadle and Tatums evidence for the
one gene-one enzyme hypothesis
34
Figure 17.2 Overview the roles of transcription
and translation in the flow of genetic
information (Layer 1)
35
Figure 17.2 Overview the roles of transcription
and translation in the flow of genetic
information (Layer 2)
36
Figure 17.2 Overview the roles of transcription
and translation in the flow of genetic
information (Layer 3)
37
Figure 17.2 Overview the roles of transcription
and translation in the flow of genetic
information (Layer 4)
38
Figure 17.2 Overview the roles of transcription
and translation in the flow of genetic
information (Layer 5)
39
Figure 17.3 The triplet code
40
Figure 17.4 The dictionary of the genetic code
41
Figure 17.5 A tobacco plant expressing a firefly
gene
42
Figure 17.6 The stages of transcription
initiation, elongation, and termination (Layer 1)
43
Figure 17.6 The stages of transcription
initiation, elongation, and termination (Layer 2)
44
Figure 17.6 The stages of transcription
initiation, elongation, and termination (Layer 3)
45
Figure 17.6 The stages of transcription
initiation, elongation, and termination (Layer 4)
46
Figure 17.6 The stages of transcription
elongation
47
Figure 17.7 The initiation of transcription at a
eukaryotic promoter
48
Figure 17.8 RNA processing addition of the 5?
cap and poly(A) tail
49
Figure 17.9 RNA processing RNA splicing
50
Figure 17.10 The roles of snRNPs and
spliceosomes in mRNA splicing
51
Figure 17.11 Correspondence between exons and
protein domains
52
Figure 17.12 Translation the basic concept
53
Figure 17.13a The structure of transfer RNA
(tRNA)
54
Figure 17.13b The structure of transfer RNA
(tRNA)
55
Figure 17.14 An aminoacyl-tRNA synthetase joins
a specific amino acid to a tRNA
56
Figure 17.15 The anatomy of a functioning
ribosome
57
Figure 17.16 Structure of the large ribosomal
subunit at the atomic level
58
Figure 17.17 The initiation of translation
59
Figure 17.18 The elongation cycle of translation
60
Figure 17.19 The termination of translation
61
Figure 17.20 Polyribosomes
62
Figure 17.21 The signal mechanism for targeting
proteins to the ER
63
Table 17.1 Types of RNA in a Eukaryotic Cell
64
Figure 17.22 Coupled transcription and
translation in bacteria
65
Figure 17.23 The molecular basis of sickle-cell
disease a point mutation
66
Figure 17.24 Categories and consequences of
point mutations Base-pair insertion or deletion
67
Figure 17.24 Categories and consequences of
point mutations Base-pair substitution
68
Figure 17.25 A summary of transcription and
translation in a eukaryotic cell
69
Figure 18.19 Regulation of a metabolic pathway
70
Figure 18.20a The trp operon regulated
synthesis of repressible enzymes
71
Figure 18.20b The trp operon regulated
synthesis of repressible enzymes (Layer 1)
72
Figure 18.20b The trp operon regulated
synthesis of repressible enzymes (Layer 2)
73
Figure 18.21a The lac operon regulated
synthesis of inducible enzymes
74
Figure 18.21b The lac operon regulated
synthesis of inducible enzymes
75
Figure 18.22a Positive control cAMP receptor
protein
76
Figure 18.22b Positive control cAMP receptor
protein
77
Figure 19.2 Part of a family of identical genes
for ribosomal RNA
78
Figure 19.3 The evolution of human ?-globin and
?-globin gene families
79
Figure 19.5 Retrotransposon movement
80
Figure 19.6 DNA rearrangement in the maturation
of an immunoglobulin (antibody) gene
81
Figure 19.7 Opportunities for the control of
gene expression in eukaryotic cells
82
Figure 19.8 A eukaryotic gene and its transcript
83
Figure 19.9 A model for enhancer action
84
Figure 21.6 Nuclear transplantation
85
Figure 21.7 Cloning a mammal
86
Figure 21.8 Working with stem cells
87
Figure 21.9 Determination and differentiation of
muscle cells (Layer 1)
88
Figure 21.9 Determination and differentiation of
muscle cells (Layer 2)
89
Figure 21.9 Determination and differentiation of
muscle cells (Layer 3)
90
Figure 21.10 Sources of developmental
information for the early embryo
91
Figure 21.11 Key developmental events in the
life cycle of Drosophila
92
Figure 21.12 The effect of the bicoid gene, a
maternal effect (egg-polarity) gene in Drosophila
93
Figure 21.13 Segmentation genes in Drosophila
94
Figure 19.10 Three of the major types of
DNA-binding domains in transcription factors
95
Figure 19.11 Alternative RNA splicing
96
Figure 19.12 Degradation of a protein by a
proteasome
97
Figure 19.13 Genetic changes that can turn
proto-ocogenes into oncogenes
98
Figure 19.14 Signaling pathways that regulate
cell growth (Layer 1)
99
Figure 19.14 Signaling pathways that regulate
cell growth (Layer 2)
100
Figure 19.14 Signaling pathways that regulate
cell growth (Layer 3)
101
Figure 19.15 A multi-step model for the
development of colorectal cancer
Recommended
CrystalGraphics Presentations


