
Weather Forecasting - PowerPoint PPT Presentation
1 / 17
Title:
Weather Forecasting
Description:
Weather Forecasting Forecasting Goal: With Respect to Severe Weather is to Minimize Impact Reduce Loss of Life and Limit Property Damage General Forecasting Notes ... – PowerPoint PPT presentation
Number of Views:374
Avg rating:3.0/5.0
Title: Weather Forecasting
1
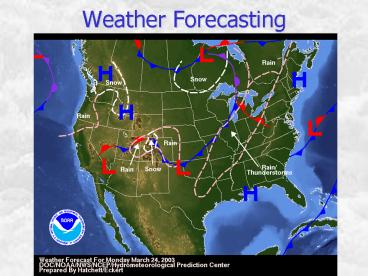
Weather Forecasting
2
Forecasting Goal With Respect to Severe Weather
is to Minimize ImpactReduce Loss of Life and
Limit Property Damage
3
General Forecasting Notes
- Four day forecasts today are about as accurate as
two day forecasts in the 1970s - Improved measurement systems are part of the
reason - Improvements in numerical modeling techniques are
part of the reason - Speed and memory increases in computers are part
of the reason
4
Forecast Methods
- Persistence (what happened today will continue
tomorrow) - Trend (temperature lowered 5 degrees in last 24
hours, will continue tomorrow) - Climatology (never rains in July, wont tomorrow)
- Interpolation (60 F at SFO, 80 at SJC so 70 at
SQL (San Carlos)) - Analogue
- Weather Types (jet stream pattern looks like
storm of Dec 95) - 30-90 Day Outlooks
- Numerical Weather Prediction (NWP) Models
5
Numerical Weather Prediction
- Initial Conditions
- Surface Observations
- Airports
- Auto Remote Sites
- Buoys
- Ships
- Upper Air
- Radiosondes
- Satellite Sounders
- Parameters
- Temperature
- Moisture
- Wind
- Pressure
6
Numerical Weather Prediction
- Grids
- Horizontal
- Vertical
- Other Inputs
- Topography
- Date/Season
- Ground Cover
- Numerical Models
- Time Step Forward
- 3, 6, 12, 24, 36, 48384hrs
7
Scales of Weather Phenomenon
8
Initializing and Running a Model
- Atmosphere is three dimensional, so both vertical
and horizontal grids are needed - Vertical grids are developed on constant pressure
surfaces (Fig 4.5) - Notice how grid lines are not equally spaced in
the verticalWhy? Answer pressure does not
decrease with height in equal proportionsgeometri
c decrease not arithmetic - Horizontal grids are typically equally spaced
- NAM (formerly called ETA) model has 60 vertical
layers and a grid spacing of 12 km (_at_ 8 miles) - Can severe weather phenomena be resolved using
such a grid? See exercise 4.1 (Noteweather
phenomena smaller than the grid spacing can not
be resolvedfor examplea 12 km grid can not
resolve a 1 km tornado
9
How Do Models Work
- Initialization Process
- Measured data are interpolated to gridpoints
- First guess (prior 12 hour forecast) data are put
on gridpoints - Observations are used to adjust first guess to
reality - Final mathematical adjustments are made to insure
that data on the model grid satisfy the equations
that govern the atmosphere
10
After Initialization Computational Work Begins
- Rates of change of variables (T,WS,P) are
evaluated from the equations and calculated over
a period of time (dx/dt) - Timesteps are usually five minutes
- Change in quantity of each variable is added to
the initial conditions, and equations are run
again - At the end of an output timestep, say 12 hours,
gridpoint solutions are filed and a mapping
process is initiated
11
Examples of Model Development DifficultiesSnowco
ver
- Snow ability to radiate energy (albedo) affects
nighttime temperaturesclear skies and snow cover
will result in lower minimums - Model must be initialized with proper snow cover
area and depth, and changes in snow cover must be
calculated - In reality, snow cover is derived from
satellites, snow depth is estimated (guessed)
12
ALBEDO
- Percent of sunlight reflected from clouds and
earth surfaces - Earth average albedo 30
Snow fresh Snow old Ice Water high sun Water low sun Bare earth Forest Green Crops Cities Clouds opaque Clouds - thin 75-95 40-60 70 3-5 10-50 15 5-10 15-25 14-18 50-85 5-50
General rule the lighter the surface the lower
the albedo
High albedo more sunlight reflected Low albedo
more sunlight absorbed
13
Examples of Model Development DifficultiesTopogr
aphy
- Mountains have a tremendous effect on weather
patterns, and coarse grid spacing is not
desirable - Gridding makes terrain features look like lego
structures - Even with refined resolution, local weather for
mountains and valleys can not be resolved
14
Examples of Model Development DifficultiesTopogr
aphy
15
Forecast Model Limitations
- Errors in Initial Conditions
- Measurements not made at exact gridpoints
- Satellite derived temperatures have errors no
RAOBS near the poles - Small errors grow over time and contaminate
forecasts
16
Forecast Model Limitations
- Inadequate Resolution
- Narrow topographical features will be
overlookedlocal rainfall forecasts are affected - Thunderstorms lake effect snowfalls and local sea
breeze conditions may be missed
17
Watches and Warnings
- Advisories
- Less Severe
- Dense Fog, Wind, Urban Flooding
- Watches
- Possible Severe Weather (could happen)
- Tornadoes, Severe Thunderstorms, Flash Flooding
- Warnings
- Probable Severe Weather (are happening)
- Tornadoes, Severe Thunderstorms, Flash Flooding