
SLOAN DIGITAL SKY SURVEY - PowerPoint PPT Presentation
Title:
SLOAN DIGITAL SKY SURVEY
Description:
SLOAN DIGITAL SKY SURVEY Scot J. Kleinman SDSS, APO, NMSU Outline I. Description of SDSS survey II. Data Products III. Data Release 1 and How to Get at it! – PowerPoint PPT presentation
Number of Views:175
Avg rating:3.0/5.0
Title: SLOAN DIGITAL SKY SURVEY
1
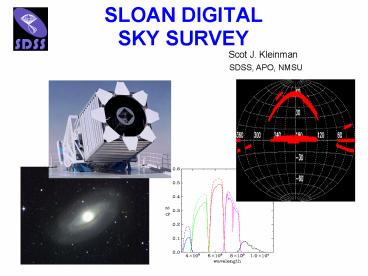
SLOAN DIGITALSKY SURVEY
Scot J. Kleinman
SDSS, APO, NMSU
2
Outline
- I. Description of SDSS survey
- II. Data Products
- III. Data Release 1 and How to Get at it!
3
Sloan Digital Sky Survey
- Goals
- 1. Image ¼ of sky in 5 bands to r23 mag
- 2. Obtain redshifts of 1 million galaxies to
r18 - 3. Obtain redshift of 100,000 quasars to r19
- 4. Approximately 100,000,000 photometric
objects! - Technique
- 1. Construct a 2.5 m telescope, CCD array
- imager, 640 fiber spectrograph at Apache
- Point, New Mexico
- 2. Operate for 5 years
- 3. Find a way to pay the bills!
4
Science Goals
- 1. Measure large scale structure of galaxies in
- a volume of 0.2 of the visible universe
- 2. Measure large scale distribution of quasars
- in a volume 100 of the visible universe
- 3. Measure structure and kinematics of stars in
- the Milky Way Galaxy
- 4. Conduct additional leading-edge science
projects
5
Partner Institutions
- Fermi National Accelerator Laboratory
- Princeton University
- University of Chicago
- Institute for Advanced Study
- Japanese Promotion Group
- US Naval Observatory
- University of Washington
- Johns Hopkins University
- Max Planck Institute for Astronomy, Heidelberg
- Max Planck Institute, Garching
- New Mexico State University
- Los Alamos National Laboratory
- University of Pittsburgh
6
Funding Agencies
- Alfred P. Sloan Foundation
- Participating Institutions
- NASA
- NSF
- DOE
- Japanese Monbukagakusho
- Max Planck Society
7
Project Schedule and Cost
- Project Timeline
- 1988 Project conceived
- 1990 Construction activities started
- April 2000 Observing operations began
- June 2005 Observing phase complete
- July 2006 Last data release
- 2005- 2007 Extension?
- Project Cost
- Construction costs 55M
- Operations cost 28M (current forecast)
- Total project cost 83M (current forecast)
8
How the SDSS Works
- Telescope
- 2.5m f/5 Richey-Chretien alt-az
- 3 deg FOV with almost no distortion
- Apache Pt. Observatory, NM, 2800m
- Imaging
- Drift-scans with 54s integrations per chip
- u22.0, g22.2, r22.2, i21.3, z20.5
- 0.4'' per pixel in a 2.5 deg field
- Median PSF 1.4'' in R
- Photometric Calibration good to 2-3
- Astrometry good to lt0.1'' rms per coordinate
9
How the SDSS Works
- Spectroscopy
- 2 640-fiber-fed dual-channel spectrographs using
pre-drilled plugplates - Red 3800-6150 Ang Blue 5800-9200 Ang
- 3'' fibers
- Resolution 1900 (1850-2200) 69km/s pixels
- Exposures typically 45min or enough to get a
S/N4 for g20.2 and i19.9
10
Survey Coverage
6000 sq. deg currently scanned
11
2.5-m Telescope
12
U. of Washington
Plug plate designs
Fermilab
Plug plates
Data Tapes
Apache Point Obs.
13
(No Transcript)
14
(No Transcript)
15
Images
- fpC.fit files are corrected frames''
- fpAtlas.fit files are postage stamp'' object
cutouts with sky subracted. - These are flat-fielded, bias-subtracted frames
with bright stars removed. Sky is NOT
subtracted, but available in FITS SKY keyword in
fpC.fit files. - An object is specified by Run, Rerun, CamCol,
Field, and ID - Details and links at http//www.sdss.org/dr1/prod
ucts/images/index.html - You'll need something to tell you the 5 magic
parameters for the field/object you want ...
16
Photometry
- tsObj.fit files are binary fits files one
object per row - Again, you need the 5 magic parameters
- 2 Sky versions'' Target and Best
- Many different magnitudes Petrosian, de
Vaucouleurs, Exponential, Model, PSF, Fiber - Bright, resolved Petrosian Unresolved PSF
Unresolved colors Model. Small bug in u
magnitudes for RED objects - Galactic extinction supplied, but not applied
- Many QA flags --- MUST be checked
- Also coordinates, proper motion, targeting
info., ROSAT/FIRST matches, ... - Details at http//www.sdss.org/dr1/products/catal
og/
17
Spectra
- spPlate.fits all calibrated spectra per plate
- spSpec.fits single calibrated spectrum.
Includes fits, and all measured parameters (lines
and synthetic u, g, and r magnitudes) - Many QA flags ...
- Classified as Unknown, Star, Galaxy, QSO, High-z
QSO, Sky, Late-type Star (M), or Emission Line
Galaxy - Need three magic parameters Plate, MJD, FiberID
- All wavelengths are VACUUM WAVELENGTHS
- Details at http//www.sdss.org/dr1/products/spect
ra/index.html
18
(No Transcript)
19
http//das.sdss.org/DR1-cgi-bin/DAS
20
http//das.sdss.org/DR1-cgi-bin/IQS
21
http//das.sdss.org/DR1-cgi-bin/SQS
22
SQL
http//skyserver.pha.jhu.edu/dr1/en/tools/search/s
ql.asp
23
SQL
24
SQL
25
SQL
Spectro Cross-ID Query to get photometric and
other information for a list of objects
identified by plate, MJD, and fiberID.
26
1. IMAGING SURVEY
North
East
27
(No Transcript)
28
Two interleaved scans (run 259, 273) taken on
succesive nights, Nov 1998
Color coding g' r' i' (3 images taken in
succession over 8 minutes)
29
Survey Layout
North Galactic Hemisphere
South Galactic Hemisphere
30
2. Process Data
31
3. Identify Galaxies, Quasars
32
Target Selection Criteria
- Main Galaxies r' lt 17.77
- 90 Galaxies/sq deg
- median z 0.1
- 6 lost due to 55 arcsec close nieghbor limit
- Red Galaxies
- Photometric redshifts with intrinsic magnitude
cut - Complete to z0.38 additional bright galaxies to
z0.5 - 12 galaxies/sq deg
- QSOs
- Complex color cuts
- i' lt 19 (z lt 3)
- i' lt 20 (z gt 3)
- 65 efficiency, 90 complete
- 13 targets/sq deg
33
4. Design Plates
34
Fiber Cartridges (9 total)
35
Plugging the fibers
Fibers come in bundles of 20. Markings on plate
help limit fiber reach.
36
5. Spectroscopy
lt-- Wavelength --gt
Spectra of 100 objects out of 640 Total
37
Elliptical galaxy spectrum z0.12
38
Spiral galaxy spectrum z0.089
39
Quasar spectrum z4.16
40
White Dwarf spectrum
M star spectrum
41
- SKY COVERAGE
42
Imaging Sky Coverage
5 Year Baseline
Gap
Completed (good)
Completed (lower quality)
43
Spectroscopy Coverage
Observed
Designed, not observed
44
DATA PRODUCTS
45
(No Transcript)
46
Status of data collection (Apr 2003)
- Imaging
- 5514 sq deg unique imaging in hand
- (8158 raw, includes repeat imaging in south)
- 22 terabytes processed through pipelines
(including reprocessing) - Spectroscopy
- 743 Unique tiles
- 139 additional special purpose plates
- 50,000 Quasars
- 300,000 Galaxies
- (bigger than 2df survey)
47
Science with the SDSS
- 31 papers submitted by collaboration in past year
(2002-2003). - 20 papers submitted by noncollaboration based on
publicly released data (EDR)
48
Galaxy Properties(Blanton, McKay, ...)
49
M101
50
NGC 660, Polar Ring galaxy
51
(No Transcript)
52
(No Transcript)
53
Weak LensingMcKay, Fischer, Sheldon, et al.
Foreground Galaxy
Background galaxy (sheared)
54
Shear and mass Density vs. Radius for ensemble
of galaxies
55
Weak Lensing Calibration of M/L
56
- Large Scale Structure and
- Galaxy Clusters
- (Annis, Kim, Dodelson, van den Berk, Zehavi, ...)
57
The clustering of galaxies that we see today
arose from quantum fluctuations laid down at the
end of the inflationary epoch in the
early universe.
Distribution of Galaxies around Sun to z0.15
58
(No Transcript)
59
Spatial 2-point Correlation Function(Zehavi et
al. 2003)
Points SDSS data Lines Best fitting halo
occupation distribution model
60
Power Spectrum(Tegmark et al 2003)
61
Nearby uncatalogued galaxy cluster
62
Abell 1689 Galaxy Cluster
63
maxBcg Algorithm
64
The maxBcg Algorithm
- Animation of process for a single galaxy
- Perform step for all galaxies
- Build a 3-d map
- Locate maxima
- Strengths
- Works to high z
- Very good photo-z
- Weaknesses
- Strong assumptions built in
65
Photometric Redshifts
66
The maxBcg Algorithm
- The 200 sq-degrees currently analyzed gives a
catalog of 4000 clusters - Photometric redshift for each cluster good to
0.015 - Mass estimates from total galaxy light
- Plot shows all clusters from a wedge 90o wide and
3o high, out to redshifts of 0.7
67
maxBcg Calibration from weak lensing
68
Mass function (from Press-Schechter theory)
Number function (from weak lensing calibration)
69
The Cluster Finding Renaissance
SDSS Cluster Finders
Photo-z is revolutionizing cluster finding
- maxBcg (Annis et al)
- Search for BCG and E/SO ridge
- Hybrid Matched Filter (Kim et al)
- Matched filter on luminosity function and radial
profile - Cut and Enhance (Goto et al)
- Color cuts, gaussian cloud, image processing
- Voronoi Tessalation (Kim et al)
- Color cuts, then tessalation
- C4 (Miller et al)
- Near neighbors in color-color space
- SRC SDSS-RASS Catalog (Annis et al)
- E/S0 overdensities at RASS faint source position
- FOG The finger of god catalog (Annis et al)
- Velocity space search for fingers of gods.
Photometry
Photometry
Photometry
Photometry
Photometry
Xray cross ID
Spectroscopy
70
SCIENCE WITH SDSS
- Quasars
- (Fan, Strauss, vanden Berk, Richards, Schneider,
Becker,...
71
How to view color-color diagrams
72
(No Transcript)
73
(No Transcript)
74
(No Transcript)
75
(No Transcript)
76
(No Transcript)
77
z6.28 Quasar (r', i', z')
78
(No Transcript)
79
(No Transcript)
80
Optical Depth vs. Redshift
81
Rare Stars(Strauss, Knapp, Harris, ...)
82
T dwarf star (ultra low mass star does not
burn hydrogren)
83
(No Transcript)
84
Cool White Dwarf
85
Flux deficit in red
86
Gamma Ray Burst Counterpart(Lee, vanden Berk,
...)
87
GRB 010222 afterglow
88
Debris in the Milky Way Halo(Yanny, Newberg,
Ivesic, ...)
89
Main Sequence Turnoff - thick disk
Main Sequence Turnoff - halo
90
Monoceros Structure
Sagittarius South Stream
New Structure?
Sagittarius North stream
F stars along Celestial Equator
91
Sagittarius color-mag diagram
92
Ghost of Sagittarius
Ghost of Sagittarius (North Stream)
93
Rings around the Galaxy (Yanny Newberg)
94
Palomar 5 Globular Cluster
95
Palomar 5 Orbit
96
Palomar 5 Tidal Tails(M. Odenkirchen et al.)
97
Near Earth Objects in SDSSSteve Kent, Tom Quinn,
Gil Holder, Mark Schaffer,Alex Szalay, Jim Gray
Coding g' r' i'
Run 2138 Camcol 2 Field 52
Run 1140 Camcol 4 Field 122
98
Distribution on Sky
99
Cumulative Distribution vs. Elongation from
Opposition
100
SDSS Colors of NEOs
C - chondritic S - stony
r-i
SMASS survey
SDSS
O Sun
g-r
101
Results
Distance D 0.06 to 0.14 AU Absolute Mag H
22-25 (32 to 160 m diameter) Simulations vs.
Observations Magnitude Distribution OK Pro
per Motion Distribution OK Sky
Distribution OK
102
Earth Collision Rate
103
Access Distribution ofSDSS Data
- I. Early Data Release (EDR)
- June 2001
- Commissioning data first survey quality data
- 460 sq deg. 24,000 spectra
- II. Data Release 1 (DR1-Beta)
- April 2003
- 2099 sq. deg. 150,000 spectra
- 3 Terabytes total
104
Data Access Mechanisms
- http//www.sdss.org/dr1/
- Data Archive Server
- Footprint
- Finding Chart
- Image Query Server
- Spectro Query Server
- rsync or http access to flatfiles
- Volume 1 square degree 1 Gbyte.
105
(No Transcript)
106
Conclusions
- SDSS is largest digital imaging survey and
largest spectroscopic survey to date - Approximately 60 complete with 5 yr survey.
- Actively exploring a 2 yr extension to fill in
gap and conduct additional surveys - Over 100 papers by collaboration and
non-collaboration - Data archive will be a unique resource for many
years. Cross-matching SDSS and other surveys
(2MASS, Galex, FIRST, ROSAT, UKIDSS) will further
expand reach and is a motivation for National
Virtual Observatory project
Recommended
CrystalGraphics Presentations


