
Cumulative frequency - PowerPoint PPT Presentation
Title:
Cumulative frequency
Description:
Cumulative frequency Example The frequency table shows the examination marks of 80 students. Mark Frequency 0 -10 2 10 -20 4 Draw a cumulative frequency table and ... – PowerPoint PPT presentation
Number of Views:91
Avg rating:3.0/5.0
Title: Cumulative frequency
1
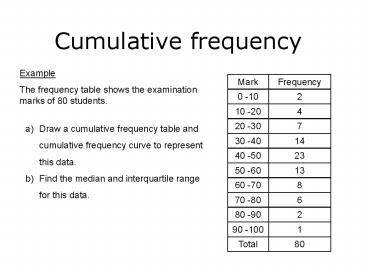
Cumulative frequency
Example The frequency table shows the
examination marks of 80 students.
Mark Frequency
0 -10 2
10 -20 4
20 -30 7
30 -40 14
40 -50 23
50 -60 13
60 -70 8
70 -80 6
80 -90 2
90 -100 1
Total 80
- Draw a cumulative frequency table and cumulative
frequency curve to represent this data. - Find the median and interquartile range for this
data.
2
Example The table below shows the results in a
recent survey on the weights of boys in a
particular school.
Weight (w kg)
Frequency 11 22 8 5
a) Draw a cumulative frequency table and
cumulative frequency curve to represent this
data. b) Find the median and interquartile range
for this data.
3
Example The masses of 150 girls were obtained
and placed in the table below.
Mass (kg) 35 40 40 45 45 50 50 55 55 60 60 65 65 70 70 75
Frequency 5 24 30 28 27 26 7 3
a) Draw a cumulative frequency polygon which
represents this data b) Find the median mass for
these girls c) Find the interquartile range for
this data d) What percentage had a weight less
than 47kg?
4
Example The table below shows the age
distribution of 200 people in a factory
Age 15 20 20 25 25 30 30 40 40 50 50 60
Frequency 18 59 63 20 25 15
a) Draw a cumulative frequency curve to represent
this data b) Use the curve to estimate the
median c) What is the interquartile range for
this data?
Recommended
CrystalGraphics Presentations


