
Bob Joyce : RSIS, Inc. - PowerPoint PPT Presentation
1 / 24
Title:
Bob Joyce : RSIS, Inc.
Description:
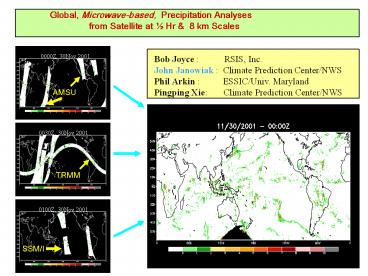
Global, Microwave-based, Precipitation Analyses from Satellite at Hr & 8 km Scales 0000Z, 30Nov 2001 0000Z, 30Nov 2001 Bob Joyce : RSIS, Inc. – PowerPoint PPT presentation
Number of Views:99
Avg rating:3.0/5.0
Title: Bob Joyce : RSIS, Inc.
1
0000Z, 30Nov 2001
Bob Joyce RSIS, Inc. John Janowiak
Climate Prediction Center/NWS Phil Arkin
ESSIC/Univ. Maryland Pingping Xie
Climate Prediction Center/NWS
AMSU
TRMM
SSM/I
2
Two primary types of precipitation algorithms
- Infrared (GPI, convective-stratiform, OPI)
- (-) indirect - can only sense cloud-top
temperature - () very good sampling characteristics
(time space)
3
(No Transcript)
4
(No Transcript)
5
Our Approach
- Use the IR and microwave data but do NOT mix them
- Use the IR only as a transport and morphing
- mechanism
- Here we use precipitation algorithms developed by
- Ferraro (NESDIS AMSU-B SSM/I) and
- Kummerow (CSU TRMM) but method is algorithm
- independent.
- Enables the generation of spatially and
temporally - complete precipitation fields while maintaining
- a pure, albeit manipulated, microwave-based
- analysis
6
Advection vectors are computed from IR for each
2.5ogridbox andall microwave pixels contained in
that grid box are propagated in the direction of
that vector
2.5o
2.5o
7
IR Spatial Correlation Domain for Computation of
Advection Vectors
2.5o
IR (t0)
2.5o
precip
8
Advection Rates for 00Z 30 Nov 2001
. EAST WEST
(pixels/hour)
MERIDIONAL
. NORTH ...SOUTH
(pixels/hour)
9
Actual Microwave Observations
t0
t2 hrs
10
(No Transcript)
11
(No Transcript)
12
(No Transcript)
13
Validation
14
Initial microwave pass
Next microwave pass
15
(No Transcript)
16
(No Transcript)
17
Microwave-Advected
GPCP 1DD
GPI (IR)
18
Potential Applications
- Real-time quantitative global precipitation
monitoring - Disaster mitigation
- Provide timely updates for U.S. interests abroad
- Numerical model initialization validation
- Improve diurnal cycle in the models
- Diagnostic studies diurnal cycle in particular
19
Continuing Work
- Account for precipitation that forms and
dissipates - between microwave overpasses
- Refine advection vector computation
- Continue validation effort
- Test/Include new precipitation products as they
- become available method is not restricted to
- particular algorithms or sensors
20
Finis
21
mm/day
Figure 5
22
Microwave propagated by IR
Another test this one is over The South
Atlantic Convergence Zone (SACZ)
Valid time is 1.5 hours after the initial pass
and 6 hours before the next pass
Initial microwave pass
Next microwave pass
Validating microwave data
23
(No Transcript)
24
Spatial Lag Correlation of IR pixel temperature
among nearby 5o x 5o grid boxes to determine
propagation direction
(t 1/2 hr)
(t 0 hr)
5o 12 pixels
5o
5o
5o 12 pixels
Recommended
CrystalGraphics Presentations


