
- PowerPoint PPT Presentation
Title:
Description:
Title: The California Institute for Telecommunications and Information Technology Author: Jerry Sheehan Last modified by: abennion Created Date: 3/10/1999 2:54:10 PM – PowerPoint PPT presentation
Number of Views:52
Avg rating:3.0/5.0
Title:
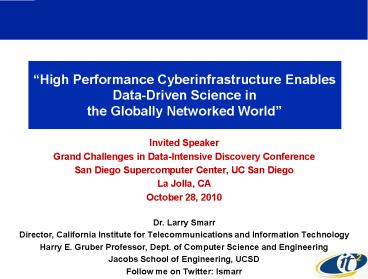
1
High Performance Cyberinfrastructure Enables
Data-Driven Science in the Globally Networked
World
- Invited Speaker
- Grand Challenges in Data-Intensive Discovery
Conference - San Diego Supercomputer Center, UC San Diego
- La Jolla, CA
- October 28, 2010
- Dr. Larry Smarr
- Director, California Institute for
Telecommunications and Information Technology - Harry E. Gruber Professor, Dept. of Computer
Science and Engineering - Jacobs School of Engineering, UCSD
- Follow me on Twitter lsmarr
2
Abstract
Today we are living in a data-dominated world
where distributed scientific instruments, as well
as supercomputers, generate terabytes to
petabytes of data. It was in response to this
challenge that the NSF funded the OptIPuter
project to research how user-controlled 10Gbps
dedicated lightpaths (or lambdas) could provide
direct access to global data repositories,
scientific instruments, and computational
resources from OptIPortals, PC clusters which
provide scalable visualization, computing, and
storage in the user's campus laboratory. The use
of dedicated lightpaths over fiber optic cables
enables individual researchers to experience
clear channel 10,000 megabits/sec, 100-1000
times faster than over todays shared Interneta
critical capability for data-intensive science.
The seven-year OptIPuter computer science
research project is now over, but it stimulated a
national and global build-out of dedicated fiber
optic networks. U.S. universities now have access
to high bandwidth lambdas through the National
LambdaRail, Internet2's WaveCo, and the Global
Lambda Integrated Facility. A few pioneering
campuses are now building on-campus lightpaths to
connect the data-intensive researchers, data
generators, and vast storage systems to each
other on campus, as well as to the national
network campus gateways. I will give examples of
the application use of this emerging high
performance cyberinfrastructure in genomics,
ocean observatories, radio astronomy, and
cosmology.
3
Academic Research OptIPlatform
CyberinfrastructureA 10Gbps End-to-End
Lightpath Cloud
HD/4k Video Cams
HD/4k Telepresence
Instruments
HPC
End User OptIPortal
10G Lightpaths
National LambdaRail
Campus Optical Switch
Data Repositories Clusters
HD/4k Video Images
4
The OptIPuter Project Creating High Resolution
Portals Over Dedicated Optical Channels to
Global Science Data
Scalable Adaptive Graphics Environment (SAGE)
Picture Source Mark Ellisman, David Lee, Jason
Leigh
Calit2 (UCSD, UCI), SDSC, and UIC LeadsLarry
Smarr PI Univ. Partners NCSA, USC, SDSU, NW,
TAM, UvA, SARA, KISTI, AIST Industry IBM, Sun,
Telcordia, Chiaro, Calient, Glimmerglass, Lucent
5
On-Line Resources Help You Build Your Own
OptIPortal
www.optiputer.net
http//wiki.optiputer.net/optiportal
www.evl.uic.edu/cavern/sage/
http//vis.ucsd.edu/cglx/
OptIPortals Are Built From Commodity PC Clusters
and LCDs To Create a 10Gbps Scalable Termination
Device
6
Nearly Seamless AESOP OptIPortal
46 NEC Ultra-Narrow Bezel 720p LCD Monitors
Source Tom DeFanti, Calit2_at_UCSD
7
3D Stereo Head Tracked OptIPortalNexCAVE
Array of JVC HDTV 3D LCD Screens KAUST NexCAVE
22.5MPixels
www.calit2.net/newsroom/article.php?id1584
Source Tom DeFanti, Calit2_at_UCSD
8
Project StarGate GoalsCombining Supercomputers
and Supernetworks
- Create an End-to-End 10Gbps Workflow
- Explore Use of OptIPortals as Petascale
Supercomputer Scalable Workstations - Exploit Dynamic 10Gbps Circuits on ESnet
- Connect Hardware Resources at ORNL, ANL, SDSC
- Show that Data Need Not be Trapped by the Network
Event Horizon
OptIPortal_at_SDSC
Rick Wagner
Mike Norman
Source Michael Norman, SDSC, UCSD
- ANL Calit2 LBNL NICS ORNL SDSC
9
Using Supernetworks to Couple End Users
OptIPortal to Remote Supercomputers and
Visualization Servers
Source Mike Norman, Rick Wagner, SDSC
ANL Calit2 LBNL NICS ORNL SDSC
10
National-Scale Interactive Remote Renderingof
Large Datasets
ESnet
Science Data Network (SDN) gt 10 Gb/s Fiber Optic
Network Dynamic VLANs Configured Using OSCARS
Eureka 100 Dual Quad Core Xeon Servers 200
NVIDIA FX GPUs 3.2 TB RAM
Interactive Remote Rendering
Real-Time Volume Rendering Streamed from ANL to
SDSC
Last Year
Last Week
- Now Driven by a Simple Web GUI
- Rotate, Pan, Zoom
- GUI Works from Most Browsers
- Manipulate Colors and Opacity
- Fast Renderer Response Time
- High-Resolution (4K, 15 FPS)But
- Command-Line Driven
- Fixed Color Maps, Transfer Functions
- Slow Exploration of Data
Source Rick Wagner, SDSC
11
NSF OOI is a 400M Program -OOI CI is 34M Part
of This
30-40 Software Engineers Housed at Calit2_at_UCSD
Source Matthew Arrott, Calit2 Program Manager
for OOI CI
12
OOI CIPhysical Network Implementation
OOI CI is Built on NLR/I2 Optical Infrastructure
Source John Orcutt, Matthew Arrott, SIO/Calit2
13
California and Washington Universities Are
Testing a 10Gbps Connected Commercial Data Cloud
- Amazon Experiment for Big Data
- Only Available Through CENIC Pacific NW GigaPOP
- Private 10Gbps Peering Paths
- Includes Amazon EC2 Computing S3 Storage
Services - Early Experiments Underway
- Robert Grossman, Open Cloud Consortium
- Phil Papadopoulos, Calit2/SDSC Rocks
14
Open Cloud OptIPuter Testbed--Manage and Compute
Large Datasets Over 10Gbps Lambdas
- Open Source SW
- Hadoop
- Sector/Sphere
- Nebula
- Thrift, GPB
- Eucalyptus
- Benchmarks
- 9 Racks
- 500 Nodes
- 1000 Cores
- 10 Gb/s Now
- Upgrading Portions to 100 Gb/s in 2010/2011
Source Robert Grossman, UChicago
15
Ocean Modeling HPC In the CloudTropical Pacific
SST (2 Month Ave 2002)
MIT GCM 1/3 Degree Horizontal Resolution, 51
Levels, Forced by NCEP2. Grid is 564x168x51,
Model State is T,S,U,V,W and Sea Surface Height
Run on EC2 HPC Instance. In Collaboration with
OOI CI/Calit2
Source B. Cornuelle, N. Martinez, C.Papadopoulos
COMPAS, SIO
16
Run Timings of Tropical PacificLocal SIO ATLAS
Cluster and Amazon EC2 Cloud
ATLAS Ethernet NFS ATLAS Myrinet, NFS ATLAS Myrinet Local Disk EC2 HPC Ethernet 1 Node EC2 HPC Ethernet Local Disk
Wall Time 4711 2986 2983 14428 2379
User Time 3833 2953 2933 1909 1590
System Time 798 17 19 2764 750
All times in Seconds
Atlas 128 Node Cluster _at_ SIO COMPAS. Myrinet
10G, 8GB/node, 3yrs old EC2 HPC Computing
Instance, 2.93GHz Nehalem, 24GB/Node,
10GbE Compilers Ethernet GNU FORTRAN with
OpenMPI Myrinet PGI FORTRAN with
MPICH1 Single Node EC2 was Oversubscribed, 48
Process. All Other Parallel Instances used 6
Physical Nodes, 8 Cores/Node. Model Code has
been Ported to Run on ATLAS, Triton (_at_SDSC) and
in EC2.
Source B. Cornuelle, N. Martinez, C.Papadopoulos
COMPAS, SIO
17
Using Condor and Amazon EC2 onAdaptive
Poisson-Boltzmann Solver (APBS)
- APBS Rocks Roll (NBCR) EC2 Roll Condor Roll
Amazon VM - Cluster extension into Amazon using Condor
Local Cluster
EC2 Cloud
Running in Amazon Cloud
NBCR VM
NBCR VM
NBCR VM
APBS EC2 Condor
Source Phil Papadopoulos, SDSC/Calit2
18
Moving into the Clouds Rocks and EC2
- We Can Build Physical Hosting Clusters
Multiple, Isolated Virtual Clusters - Can I Use Rocks to Author Images Compatible
with EC2? (We Use Xen, They Use Xen) - Can I Automatically Integrate EC2 Virtual
Machines into My Local Cluster (Cluster
Extension) - Submit Locally
- My Own Private Public Cloud
- What This Will Mean
- All your Existing Software Runs Seamlessly Among
Local and Remote Nodes - User Home Directories Can Be Mounted
- Queue Systems Work
- Unmodified MPI Works
Source Phil Papadopoulos, SDSC/Calit2
19
Blueprint for the Digital University--Report of
the UCSD Research Cyberinfrastructure Design Team
- Focus on Data-Intensive Cyberinfrastructure
April 2009
No Data Bottlenecks--Design for Gigabit/s Data
Flows
http//research.ucsd.edu/documents/rcidt/RCIDTRepo
rtFinal2009.pdf
20
Current UCSD Optical CoreBridging End-Users to
CENIC L1, L2, L3 Services
Lucent
Glimmerglass
Force10
Source Phil Papadopoulos, SDSC/Calit2 (Quartzite
PI, OptIPuter co-PI) Quartzite Network MRI
CNS-0421555 OptIPuter ANI-0225642
21
UCSD Campus Investment in Fiber Enables
Consolidation of Energy Efficient Computing
Storage
WAN 10Gb CENIC, NLR, I2
N x 10Gb
DataOasis (Central) Storage
Gordon HPD System
Cluster Condo
Triton Petascale Data Analysis
Scientific Instruments
OptIPortal Tile Display Wall
Campus Lab Cluster
Digital Data Collections
Source Philip Papadopoulos, SDSC/Calit2
22
UCSD Planned Optical NetworkedBiomedical
Researchers and Instruments
- Connects at 10 Gbps
- Microarrays
- Genome Sequencers
- Mass Spectrometry
- Light and Electron Microscopes
- Whole Body Imagers
- Computing
- Storage
23
Moving to a Shared Campus Data Storage and
Analysis Resource Triton Resource _at_ SDSC
Triton Resource
- Large Memory PSDAF
- 256/512 GB/sys
- 9TB Total
- 128 GB/sec
- 9 TF
- Shared Resource
- Cluster
- 24 GB/Node
- 6TB Total
- 256 GB/sec
- 20 TF
x256
x28
UCSD Research Labs
- Large Scale Storage
- 2 PB
- 40 80 GB/sec
- 3000 6000 disks
- Phase 0 1/3 TB, 8GB/s
Campus Research Network
Source Philip Papadopoulos, SDSC/Calit2
24
Calit2 Microbial Metagenomics Cluster-Next
Generation Optically Linked Science Data Server
25
Calit2 CAMERA Automatic Overflows into SDSC
Triton
_at_ SDSC
Triton Resource
_at_ CALIT2
CAMERA -Managed Job Submit Portal (VM)
Transparently Sends Jobs to Submit Portal on
Triton
10Gbps
Direct Mount No Data Staging
CAMERA DATA
26
Prototyping Next Generation User Access and Large
Data Analysis-Between Calit2 and U Washington
Photo Credit Alan Decker
Feb. 29, 2008
Ginger Armbrusts Diatoms Micrographs,
Chromosomes, Genetic Assembly
iHDTV 1500 Mbits/sec Calit2 to UW Research
Channel Over NLR
27
Rapid Evolution of 10GbE Port PricesMakes
Campus-Scale 10Gbps CI Affordable
- Port Pricing is Falling
- Density is Rising Dramatically
- Cost of 10GbE Approaching Cluster HPC
Interconnects
80K/port Chiaro (60 Max)
5K Force 10 (40 max)
1000 (300 Max)
500 Arista 48 ports
400 Arista 48 ports
2005 2007
2009
2010
Source Philip Papadopoulos, SDSC/Calit2
28
10G Switched Data Analysis ResourceData Oasis
(RFP Responses Due 10/29/2010)
OptIPuter
RCN
Colo
CalRen
Triton
32
20
Trestles
24
32
2
Existing Storage
12
40
Dash
Oasis Procurement (RFP)
8
- Phase0 gt 8GB/s sustained, today
- RFP for Phase1 gt 40 GB/sec for Lustre
- Nodes must be able to function as Lustre OSS
(Linux) or NFS (Solaris) - Connectivity to Network is 2 x 10GbE/Node
- Likely Reserve dollars for inexpensive replica
servers
1500 2000 TB gt 40 GB/s
Gordon
100
Source Philip Papadopoulos, SDSC/Calit2
29
You Can Download This Presentation at
lsmarr.calit2.net
Recommended
CrystalGraphics Presentations


