
Poverty and Human Development Report Geographic Diversity of Poverty - PowerPoint PPT Presentation
1 / 17
Title:
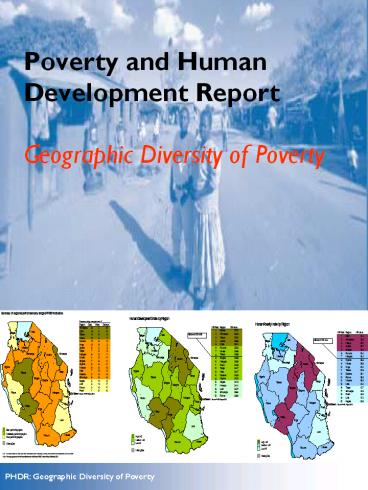
Poverty and Human Development Report Geographic Diversity of Poverty
Description:
This presentation Introduction Methodologies Single indicator approach Human Development Index (HDI) Human Poverty Index (HPI) ... – PowerPoint PPT presentation
Number of Views:233
Avg rating:3.0/5.0
Title: Poverty and Human Development Report Geographic Diversity of Poverty
1
Poverty and Human Development
ReportGeographic Diversity of Poverty
PHDR Geographic Diversity of Poverty
Professor Amani, ESRF
2
This presentation
- Introduction
- Methodologies
- Single indicator approach
- Human Development Index (HDI)
- Human Poverty Index (HPI)
- Concluding remarks
General Findings
3
IntroductionWhy analysis of poverty status at
sub-national level?
- Increased awareness among stakeholders on
sub-national differences - Contribution to better focused more effective
policies and strategies - Guidance to resource allocation of resources to
local authorities, contributing to improved
planning at that level
4
Methodology
- Choice of methodology to assess regional
differences in status of poverty depends on
purpose of the assessment
To raise awareness and advocate on the overall
regional status of human development in a country
To inform planning, policy or strategy
development within a sector
Single Indicator Approach
Composite Index Approach
5
Methodology
- Single Indicator Approach
- Based on PRSP indicators
- Total of 28 indicators from 4 clusters
- Performance by region and ranking included
- Income poverty
- Human capabilities
- Survival
- Nutrition
6
Methodology
- Human Development Index (HDI)
- Summary measure of human development
- It measures average (regional) achievements in
three basic dimensions of human development
- A long and healthy life (life expectancy at
birth) - Knowledge (adult literacy rate, gross enrolment
rate) - A decent standard of living (GDP per capita PPP)
7
Methodology
- Human Development Index (HDI)
- PHDR consumption expenditure (CE)per capita used
in stead of GDP per capita PPP. - Data more reliable and more recent
- CE direct measure of standard of living and
reflects the situation at household level better
than GDP
8
Methodology
- Human Poverty Index (HPI)
- Summary measure of deprivation in three basic
dimensions of human development
- Lack of a long and healthy life. Vulnerability
to death at early age (probability of not
surviving beyond 40 yrs) - Lack of knowledge. Exclusion from learning(adult
illiteracy ) - Lack of a decent standard of living (population
not using safe water, percentage of children lt5
who are underweight)
9
General Findings
- Single Indicator Approach
- Analysis
- Interregional disparities
- Performance of a region on a range of indicators
- Identification of trends and patterns
10
General Findings
Single Indicator Approach
- Analysis
- Interregional disparities
- Performance of a region on a range of indicators
- Identification of trends and patterns
- PNER Tanzania 57
- Kilimanjaro 80.5
- Lindi 43
- Iringa
- Among best 5 on 12 indicators
- Among worst 5 on 9 indicators
- Dar es Salaam and Kilimanjaro region consistently
among best 5 for PRSP indicators - Pwani, Lindi, Rukwa consistently among worst 5
for PRSP indicators
11
General Findings
- Single Indicator Approach
12
General Findings
- Marked gap
- between
- 1-2, 2-rest
13
General Findings
- Human Development Index
14
General Findings
- Human Poverty Index
Marked gap between Kilimanjaro and Mbeya
Regardless of Methodology Dar es Salaam,
Kilimanjaro, Mbeya and Ruvuma consistently at
top end of the ranking Lindi and Shinyanga
consistently at bottom end of ranking
15
General Findings
Human Poverty Index
16
General Findings
- Inconsistencies when comparing HDI and HPI
HDI rank
HPI rank
1
- Caused by different indicators used in HDI and
HPI - Absence of expenditure component in HPI improves
Rukwas ranking, but has a negative effect on
Pwanis Ranking - Introducing access to safe water in the equasion
for HPI has a negative effect on the ranking of
Pwani.
Pwani (11)
10
13
18
20
Rukwa (20)
17
Concluding remarks
- This analysis provides further evidence on
diversity of poverty in Tanzania - A national perspective alone obscures details
important for informed decision making on poverty
reduction - The methodologies used reveal both similarities
in regional performance as well as differences - No single methodology will provide all answers
- More in depth analysis required focusing on WHY
some regions perform better than others - Future work may also include sub-regional
analysis, using census data and poverty mapping
Recommended
CrystalGraphics Presentations


