
Figure 1.2 The hierarchy of biological organization - PowerPoint PPT Presentation
1 / 53
Title:
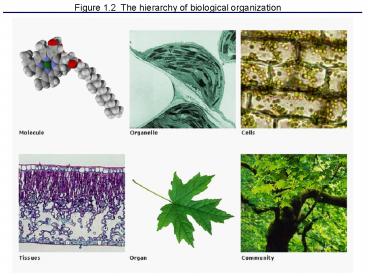
Figure 1.2 The hierarchy of biological organization
Description:
Figure 1.2 The hierarchy of biological organization Figure 12.5 The stages of mitotic cell division in an animal cell: G2 phase; prophase; prometaphase Figure 12.5 ... – PowerPoint PPT presentation
Number of Views:96
Avg rating:3.0/5.0
Title: Figure 1.2 The hierarchy of biological organization
1
Figure 1.2 The hierarchy of biological
organization
2
Figure 7.4 A prokaryotic cell
3
Figure 7.5 Geometric relationships explain why
most cells are microscopic
4
Figure 7.7 Overview of an animal cell
5
Figure 7.8 Overview of a plant cell
6
Figure 7.14 The formation and functions of
lysosomes (Layer 3)
7
Figure 8.1 Artificial membranes (cross sections)
8
Figure 8.6 The detailed structure of an animal
cells plasma membrane, in cross section
9
Figure 8.10 The diffusion of solutes across
membranes
10
Figure 8.11 Osmosis
11
Figure 8.12 The water balance of living cells
12
Figure 8.16 Review passive and active transport
compared
13
Figure 8.19 The three types of endocytosis in
animal cells
14
Table 40.1 Organ Systems Their Main Components
and Functions in Mammals
15
Reading a Nutritional Label
16
Figure 5.2 The synthesis and breakdown of
polymers
17
Figure 5.5 Examples of disaccharide synthesis
18
Figure 5.6 Storage polysaccharides
19
Figure 5.8 The arrangement of cellulose in plant
cell walls
20
Figure 5.10 The synthesis and structure of a
fat, or triacylglycerol
21
Figure 5.11 Examples of saturated and
unsaturated fats and fatty acids
22
Figure 5.12 The structure of a phospholipid
23
Figure 5.16 Making a polypeptide chain
24
Figure 5.29 The components of nucleic acids
25
Table 5.2 Polypeptide Sequence as Evidence for
Evolutionary Relationships
26
Figure 16.5 The double helix
27
Figure 16.7 A model for DNA replication the
basic concept (Layer 1)
28
Figure 16.7 A model for DNA replication the
basic concept (Layer 2)
29
Figure 16.7 A model for DNA replication the
basic concept (Layer 3)
30
Figure 16.7 A model for DNA replication the
basic concept (Layer 4)
31
Figure 16.13 Synthesis of leading and lagging
strands during DNA replication
32
Figure 12.3 Chromosome duplication and
distribution during mitosis
33
Figure 12.4 The cell cycle
34
Figure 12.5 The stages of mitotic cell division
in an animal cell G2 phase prophase
prometaphase
35
Figure 12.5 The stages of mitotic cell division
in an animal cell metaphase anaphase telophase
and cytokinesis.
36
Figure 12.5x Mitosis
37
Figure 13.7 The stages of meiotic cell division
Meiosis I
38
Figure 13.7 The stages of meiotic cell division
Meiosis II
39
Figure 13.8 A comparison of mitosis and meiosis
40
Figure 13.8 A comparison of mitosis and meiosis
summary
41
Figure 13.9 The results of alternative
arrangements of two homologous chromosome pairs
on the metaphase plate in meiosis I
42
Figure 13.10 The results of crossing over during
meiosis
43
Figure 17.2 Overview the roles of transcription
and translation in the flow of genetic
information (Layer 1)
44
Figure 17.2 Overview the roles of transcription
and translation in the flow of genetic
information (Layer 2)
45
Figure 17.2 Overview the roles of transcription
and translation in the flow of genetic
information (Layer 3)
46
Figure 17.2 Overview the roles of transcription
and translation in the flow of genetic
information (Layer 4)
47
Figure 17.2 Overview the roles of transcription
and translation in the flow of genetic
information (Layer 5)
48
Figure 17.3 The triplet code
49
Figure 17.12 Translation the basic concept
50
Figure 17.13a The structure of transfer RNA
(tRNA)
51
Figure 17.13b The structure of transfer RNA
(tRNA)
52
Figure 17.24 Categories and consequences of
point mutations Base-pair insertion or deletion
53
Figure 17.24 Categories and consequences of
point mutations Base-pair substitution
Recommended
CrystalGraphics Presentations


