
Tropical Cyclone Climatology - PowerPoint PPT Presentation
1 / 37
Title:
Tropical Cyclone Climatology
Description:
Title: PowerPoint Presentation Last modified by: Matthew D Eastin Created Date: 1/1/1601 12:00:00 AM Document presentation format: On-screen Show (4:3) – PowerPoint PPT presentation
Number of Views:354
Avg rating:3.0/5.0
Title: Tropical Cyclone Climatology
1
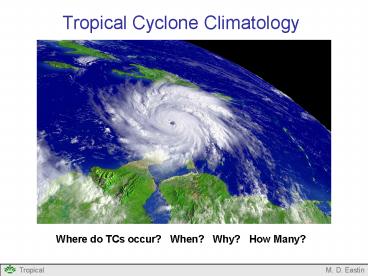
Tropical Cyclone Climatology
Where do TCs occur? When? Why? How Many?
2
Tropical Cyclone Definitions
Tropical Cyclone (TC) Generic term for a
non-frontal synoptic-scale low pressure
system over tropical or subtropical waters
with organized convection and a definite
cyclonic surface wind circulation Tropical
Depression (TD) A TC with maximum sustained
surface winds lt 17 m/s Tropical Storm (TS) A
TC with maximum sustained surface winds gt 17
m/s (gt 33 knots or gt 37 mph) Becomes a
named system Hurricane (H) A TC with maximum
sustained surface winds gt 33 m/s (gt 64
knots or gt 74 mph) Hurricane N Atlantic,
NE Pacific, SE Pacific Typhoon NW
Pacific Severe Tropical Cyclone SW Pacific,
SE Indian Severe Cyclonic Storm N
Indian Tropical Cyclone SW Indian
3
Tropical Cyclone Definitions
What is a sustained wind? Wind speed
determined by averaging observed values
over a given amount of time (either 1-min or
10-min) 1-min U.S. National Hurricane
Center (Atlantic / East Pacific) Joint
Typhoon Warning Center (Pacific /
Indian) 10-min Japan Japanese
Meteorological Agency (West Pacific) India
Indian Meteorological Dept. (North
Indian) France MeteoFrance (South Indian)
Australia Regional TC Centers (Australian
Region) Fiji Regional TC Centers (South
Central Pacific) Not the official WMO
forecast center
1-min Max Mean 30.6 m/s 10-min Mean 26.3 m/s
4
Tropical Cyclone Definitions
What is a surface wind? Wind speed observed at
10-m above the ground Observations made at
different altitudes can be adjusted to 10-m
assuming certain boundary-layer characteristics
Typical Boundary Layer Mean Wind
Profiles
5
Tropical Cyclone Formation Locations
Figure from Gray (1968)
What are common features in these areas of the
world?
6
Common Factors Favorable for Development
- Warm Sea Surface Temperatures (SSTs)
- Generally gt 26.5C
- TCs are most common over waters gt 28ºC
- Low vertical wind shear near the center of the
system - 200 - 850 mb difference usually lt 20 m/s
- TCs are most common in regions with shear lt 10
m/s - Significant planetary vorticity
- Coriolis force usually poleward of 5
- Most TCs occur in the 10º-20º latitudinal belts
- Moist troposphere
- Generally gt 40-50 at mid-levels
7
Limiting Factors
- In much of the Tropics, the SST is generally
warm - enough for TC development
- Exceptions SE Atlantic
- SE Pacific
- Central Pacific (marginal)
- In those regions with warm SSTs and ample
planetary vorticity, - vertical wind shear usually limits TC
development - Dry air at mid-levels can also limit
development in some - regions where the SST and vertical shear are
favorable - (most evident in the Atlantic ? Subsidence
in Bermuda High) - ( ? Saharan Air Layer
)
8
Sea Surface Temperature
9
Sea Surface Temperature
10
Sea Surface Temperature
11
Sea Surface Temperature
12
200-850 mb Vertical Wind Shear
January
August
Figures from Gray (1968)
13
700-mb Relative Humidity
14
700-mb Relative Humidity
15
700-mb Relative Humidity
16
700-mb Relative Humidity
17
North Indian
Figure from Gray (1968)
- Average of 5 tropical cyclones each year
- Two seasons per year (Apr-Jun and Sep-Dec)
- Most occur in the Bay of Bengal and move toward
the NW - Development linked to monsoon trough passage
- Deadliest TC in history struck Bangladesh in
1970 killing over 300,000 people
18
South Indian
Figure from Gray (1968)
- Average of 8 tropical cyclones each year
- Season runs from October through May
- Most move to the west and southwest
- Development linked to the poleward movement of
the - equatorial trough (inter-tropical convergence
zone ITCZ)
19
NW Australia and South Pacific
Figure from Gray (1968)
- Average of 14 tropical cyclones each year
- Season runs from November through June
- Most move to the west and southwest
- Development limited by high wind shear poleward
of 20
20
NW Pacific
Figure from Gray (1968)
- Average of 31 tropical cyclones each year
- Season runs year round, but 70 occur in
Jul-Oct - Most move to the west and northwest
- Development influenced by the equatorial and
monsoon troughs - About 35 of all TCs occur in the NW Pacific
21
NE Pacific
Figure from Gray (1968)
- Average of 16 tropical cyclones each year
- Season runs from May-October (peak in Aug)
- Most move to the west and northwest
- Development influenced by the equatorial trough
and easterly waves - Development poleward of 20 limited by cold
SSTs, dry air, - and high wind shear
22
North Atlantic
Figure from Gray (1968)
- Average of 10 tropical cyclones each year
- Season runs from June-November
- Most move to the west and northwest
- Development linked to easterly waves,
upper-level lows - and stationary frontal boundaries
- Basin with the greatest diversity in storm
formation and behavior
23
North Atlantic
24
North Atlantic
- Development limited to western Caribbean and
Gulf - SSTs are too cool in the Atlantic
25
North Atlantic
- Development in Caribbean and Gulf
- SSTs begin to warm in the Atlantic
- Easterly waves begin to emerge off African coast
26
North Atlantic
- Development throughout the basin
- Easterly waves activity peaks in late August
through early September
27
North Atlantic
- Development throughout the basin
- Lowest vertical shear in September
- Basin-average SSTs are the greatest
28
North Atlantic
- Development in Caribbean and along U.S. coast
- Vertical shear begins to increase over Atlantic
- Development from upper-level lows and frontal
boundaries - are much more common
29
North Atlantic
- Development usually limited to the Caribbean
- Elsewhere, SSTs are too cool and/or vertical
shear is too high
30
North Atlantic
31
North Atlantic
32
North Atlantic
33
North Atlantic
34
North Atlantic
35
North Atlantic
36
Tropical Cyclone Climatology
- Summary
- Tropical cyclones vary in name and definition in
different - regions of the Tropics
- Tropical cyclones occur throughout most
tropical regions - Tropical cyclones form when a number of
necessary - (but not sufficient) conditions are in
place - Warm SSTs
- Low vertical wind shear
- A moist mid-level troposphere
- Some planetary vorticity
- These conditions most often occur in the NW
Pacific where - the most TCs are observed annually
- The North Atlantic sees the greatest shift in
development
37
References
Gray, W. M., 1968 Global view of the origin of
tropical disturbances and storms. Mon. Wea.
Rev., 96, 669-770. Tropical Prediction Center
(TPC) / National Hurricane Center (NHC)
website (http//www.nhc.noaa.gov/) NOAA Climate
Diagnostic Center (CDC) website
(http//www.cdc.noaa.gov/cgi-bin/data/getpage.pl
)
Recommended
CrystalGraphics Presentations


