
Notes Over 4.7 - PowerPoint PPT Presentation
1 / 8
Title:
Notes Over 4.7
Description:
Notes Over 4.7 Solving an Equation Graphically Solve the equation graphically. Check your solution algebraically. Set equation equal to 0. Graph the related function. – PowerPoint PPT presentation
Number of Views:70
Avg rating:3.0/5.0
Title: Notes Over 4.7
1
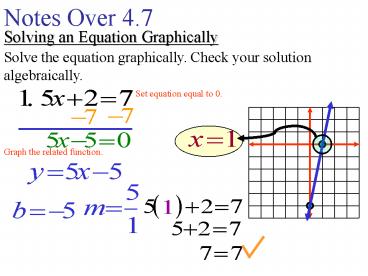
Notes Over 4.7
Solving an Equation Graphically
Solve the equation graphically. Check your
solution algebraically.
Set equation equal to 0.
Graph the related function.
2
Notes Over 4.7
Solving an Equation Graphically
Solve the equation graphically. Check your
solution algebraically.
Graph the related function.
3
Notes Over 4.7
Solving an Equation Graphically
Solve the equation graphically. Check your
solution algebraically.
Graph the related function.
4
Notes Over 4.7
Solving an Equation Graphically
Solve the equation graphically. Check your
solution algebraically.
Graph the related function.
5
Notes Over 4.7
Solving an Equation Graphically
Solve the equation graphically. Check your
solution algebraically.
Graph the related function.
6
Notes Over 4.7
Solving an Equation Graphically
Solve the equation graphically. Check your
solution algebraically.
Graph the related function.
7
Notes Over 4.7
Using Slope-Intercept Form to Solve a Real-Life
Problem
7. Based on data from 1992 to 1995, a model for
the United States consumer price index n is n
4t 140.35, where t is the number of years since
1992. According to this model, in what year will
the United States have a consumer price index of
180.4.
5 -5 -15 -25 -35 -45
10 years from 1992 will be 2002
8
Notes Over 4.7
Recommended
CrystalGraphics Presentations


