
Statistics for Transparency, Accountability, - PowerPoint PPT Presentation
Title:
Statistics for Transparency, Accountability,
Description:
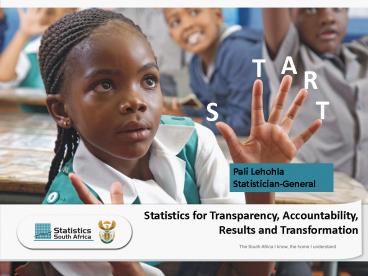
A T R T S Pali Lehohla Statistician-General Statistics for Transparency, Accountability, Results and Transformation – PowerPoint PPT presentation
Number of Views:106
Avg rating:3.0/5.0
Title: Statistics for Transparency, Accountability,
1
A
T
R
T
S
Pali Lehohla Statistician-General
Statistics for Transparency, Accountability,
Results and Transformation
2
Outline of Presentation
A
T
Start with the end in mind Prescripts of
national and global imperatives Do we know what
we need to know Put use at the centre
WHY Organize for delivery Deliver results
R
T
S
Use
3
International AgendaPost 2015 AgendaNational
AgendaA better life for all Driving
transformationStatistics for Transparency,
Accountability, Results and Transformation
Start with the end in mind
S
Impact on Society
T
A
R
T
4
Leave no one behindPut sustainable development
at the coreTransform economies for jobs and
inclusive growthBuild peace and effective open
accountable institutions for allForge a new
global partnership
Start with the end in mind
Post 2015 Agenda
S
T
A
This change should inspire a new generation to
believe that a better world is within its reach
and thus can act accordingly
R
T
5
Outcome use of evidence
For USE in Planning (baseline information for
NDP) Monitoring Evaluation (measuring
development and impact) Policy
development increasing rationale for making
decisions for better policies) Decision-making (
Decision making in government, subnational,
business the public)
Increased knowledge, understanding and use by the
leadership, citizens and state
6
What is the evidence that the census products are
used?By what means can we verify that the
census results are used?What instruments can we
create and apply to ensure use?
Critical questions
S
T
Use
A
R
T
7
Statistical Products
Do the policy questions inform the statistical
products? Do we know and understand the quality
of health services and the difficulties that
confront people when they go to public health
facilities? Do we know and understand what is
happening in our education system, do we know
what the conditions are in our rural schools? Do
we know and understand the living conditions and
housing in townships where the majority of our
people live?
8
Use as fundamental for strategic shift
indicators of use
Statistics forgtgt Transparency Accountability Results Transformation
Statistical leadership Embed use through legislative and institutional authority Use statistics for mutual trust in statecraft Use statistics for mutual accountability and governance Use statistics for results-based management Use statistics to lead change for different and better results
Strategic planning Embed use in administrative practices and procedures Use statistical metrics for fact based norms and standards Use statistical indicators for mutual accountability Use statistical targets for results based management Use statistical metrics to drive change
Statistical products Embed use through application of products in service delivery Ensure that products are accessible and understood Ensure that products anticipate and respond to policy questions and concerns Ensure that you provide evidence about the use of products Use statistical product s measure outcomes and impact measures to spur change
Statistical process Embed use through consultation, training and user support Provide metadata with the results Anticipate user and support needs Report in cycles predictable Put systems and infrastructure for access and use of results Inspire better and different outcome expectations to drive change
Organisation management Embed use in the organisation Ensure that methods are known and understood Publish statistics that are produced and ensure access Anticipate user requests and address them Use lessons learnt to catalyse change for better
9
Statistics for Transparency, Accountability,
Results and Transformation
A Better Life for All
Impact on Society
Economic growth transformation
Healthy life
Improved service delivery
People are feel safe
Decent jobs
Increased use of statistical information as
evidence in
Outcome Evidence for decisions
Decision- making
Policy development
Planning
Monitoring Evaluation
Employment
Finance
Education
Transport
Statistical products In space
Population
Mining
Agriculture
Service Delivery
Manufacturing
Trade
Construction
Utilities
Businesses processes
Governance Administration
Statistical production
Stakeholder management
Dwelling Frame
Invest in learning and growth
Technology Infrastructure
Organisation
People
10
Statistical Process
11
Organisation and Management
Statistical leadership and management
(Fundamental principles of Official Statistics,
Code of ethics, Statistics Legislation)
Strategic management (Strategy development,
planning and review)
Stakeholder management (The public, government,
civil society, the media, business, researchers)
People management (statistical skills, knowledge
and capabilities)
Technology and Infrastructure (collection,
processing, analysis, dissemination, use)
Governance and administration (Finance and
resource management)
12
Restructuring the PR
Introduction Section 1 Impact on
Society Section 2 Outcome Evidence for use in
decision-making Section 3 Statistical
products Section 4 Statistical process Section
5 Organisation and Management Census topics to
move to Annexures
S
T
Use
A
R
T
Strategic shift in conducting censuses in the
21st century
13
Step change Use at the centre
S
Statistics are numerical facts for statecraft
T
Transparency is a pre-audit to ensure
predictability
Use
A
Accountability is taking responsibility and
accepting consequences
R
Results allow parties to read the same facts
T
Transformation is action in unison to drive
change for the better
Recommended
CrystalGraphics Presentations


