
Graphing Inequalities in Two Variables - PowerPoint PPT Presentation
1 / 14
Title:
Graphing Inequalities in Two Variables
Description:
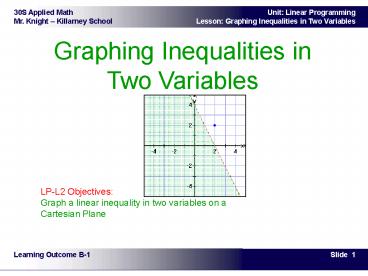
Graphing Inequalities in Two Variables LP-L2 Objectives: Graph a linear inequality in two variables on a Cartesian Plane Learning Outcome B-1 When you place a line on ... – PowerPoint PPT presentation
Number of Views:240
Avg rating:3.0/5.0
Title: Graphing Inequalities in Two Variables
1
Graphing Inequalities in Two Variables
LP-L2 Objectives Graph a linear inequality in
two variables on a Cartesian Plane
Learning Outcome B-1
2
- When you place a line on a coordinate plane, the
line creates three regions - the region that is the line itself
- the region to the left of the line
- the region to the right of the line
- Consider the graph of the equation y 2x
1shown. It separates the coordinate plane into
two half-planes. One half-plane, Region 1, is on
the left of the line. The point A with
coordinates (-4, 3) is in Region 1.
Theory Inequalities in Two Dimensions
3
If the x-coordinate of point A, -4, is
substituted into the equation of the line to find
the corresponding y-coordinate on the line, the
result is y 2x 1y 2(-4) 1, ory -7.
In other words, the y-value for the point A is
greater than the y-value for the line. Use
another point in Region 1 to verify the
relationship. The y- values in Region 1 for a
given x-value are greater than the y-values on
the line.This region or half-plane can be
represented by the inequality y gt 2x 1.
Theory Inequalities in Two Dimensions
4
What inequality do you think represents the area
in Region 2? The other half-plane (Region 2) is
on the right ofthe line. The point B with
coordinates (2, 2) is in Region 2.If the
x-coordinate of point B, 2, is substituted
intothe equation of the line to find the
correspondingy-coordinate on the line, the
result isy 2x 1y 2(2) 1, ory 5.
In other words, the y-value for the point B is
less than the y-value for the line. The y- values
in Region 2 for a given x-value are less than the
y-values on the line. This region or half-plane
can be represented by the inequality y lt 2x 1.
Theory Inequalities in Two Dimensions
5
SummaryA line divides the coordinate plane into
two half-planes, which can each be represented by
an inequality statement.In our example, the
line y 2x 1 divides the coordinate plane into
two halves.Given the lines positive slope, the
left half can be represented by the equation y gt
2x 1, and the right half can be represented by
the equation y lt 2x 1.
Theory Inequalities in Two Dimensions
6
- ExampleGraph the region 2x y lt 4.
- Steps
- Solve for y.
- Determine dashed or solid line.
- Select a point and test in inequality.
- Shade accordingly. (If test was true, shade
region that includes point. If false, shade
other side of boundary.)
Example Inequalities in Two Dimensions
7
ExampleGraph the region 2x y lt 4. Solution
Example Inequalities in Two Dimensions
8
Graph the region
Test Yourself
9
Graph the region
Test Yourself
10
Graph the region
Test Yourself
11
Graph the region
Test Yourself
12
Graph the region
Test Yourself
13
Special Case Graph the region
Test Yourself
14
Special Case Graph the region
Test Yourself
Recommended
CrystalGraphics Presentations


