
Substation - PowerPoint PPT Presentation
1 / 104
Title:
Substation
Description:
... EHV transformer failure, ... asset classification into consideration when determining overall operational risk to the organization 27 Power factor testing, ... – PowerPoint PPT presentation
Number of Views:945
Avg rating:3.0/5.0
Title: Substation
1
Substation
2014 Transmission Distribution
Benchmarking Insights Conference
- August 20-22, 2014
- Vail, CO
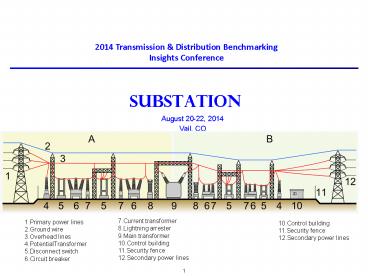
7.Current transformer 8.Lightning arrester 9.Main
transformer 10.Control building 11.Security
fence 12.Secondary power lines
1.Primary power lines 2.Ground wire 3.Overhead
lines 4.PotentialTransformer 5.Disconnect switch
6.Circuit breaker
10.Control building 11.Security fence
12.Secondary power lines
2
Agenda
- Key issues
- Statistics and System Activity
- Financial
- Practices and Initiatives
3
Key Benchmarking issues in substations
Industry Issues
Methodology
- Regulation
- NERC reporting (TADS)
- NERC compliance FERC
- Technology
- Substation Automation
- Age and obsolescence of components
- Problematic equipment
- Smart Grid requirements
- Planning to Build Process
- Planning Process
- Estimating tools
- Lead times for major equipment
- Lead times for environmental/permitting issues
- Competing goals of TD organizations
- Planning/Engineering/Design coordination
- Workforce issues
- Contract Management
- Aging workforce
- Availability and quality of internal and contract
resources
- TD Costs are separated by FERC, but the
"substation" account is not. Costs need to be
allocated - FERC allows some latitude in the distinction
between distribution and transmission
substations. For substations that have TD
facilities, the cost split is not always
consistent - In most organizations TD Substations are
typically managed in the same department, usually
transmission. But there are T-only or D-only
companies that are interested in separating
T-subs vs. D-subs. - Different voltage levels, purposes, levels of
transformation, rollover schemes, loadings and
designs make benchmarking comparisons problematic - There is no consensus on normalizing variables
customers, installed MVA, average of peak load,
assets, and book values. - There is a lag in when capital additions are
reported which is reflected in changes in CWIP
accounts,
- 2014
- Physical Security
- Storm Threat
- Spending Up
4
2014 TD Capital Projects CAPITAL SPENDING
FORECAST TD SUBSTATIONS ACTIVITY- BASED
Mean Quartile
Mean 0.91
Quartile 1 0.46
Quartile 2 0.85
Quartile 3 1.01
Comments
Calculation used ( ( CP125.1B CP125.2B
CP125.3B ) / 3 ) / ( (TF50_ABC Trans Subs Cap
v14) (DF55_Dist Subs Cap ABC v.14) )
5
Transmission Substation Trends
- We see an increase in spending for 2013 . . .
6
Statistics and System Activity
7
Distribution Substations Demographic Profile
Min Mean Max of Bars
Organizational Demographics Organizational Demographics Organizational Demographics Organizational Demographics
Wage Rate Substation Journey Level Electrician Wage Rate Substation Journey Level Electrician Wage Rate Substation Journey Level Electrician 33.24 38.21 41.97 12
Substation Staffing FTEs per 100M Substation Assets Substation Staffing FTEs per 100M Substation Assets Substation Staffing FTEs per 100M Substation Assets 8.46 16.10 32.94 11
Demographics Distribution Demographics Distribution Demographics Distribution Demographics Distribution
Distribution Substations per 100 Distribution structure mile Distribution Substations per 100 Distribution structure mile Distribution Substations per 100 Distribution structure mile 0.64 2.16 3.86 7
Distribution Substations Transformer Banks by Voltage Level Distribution Substations Transformer Banks by Voltage Level Distribution Substations Transformer Banks by Voltage Level
5kV class gt1kV, lt9kV 5kV class gt1kV, lt9kV 0.0 23.4 76.2 14
15kV class gt9kV, lt15kV 15kV class gt9kV, lt15kV 16.9 64.1 99.1 14
25kV class gt15kV to lt26kV 25kV class gt15kV to lt26kV 0.0 6.5 60.4 14
35kV class gt26kV to lt36kV 35kV class gt26kV to lt36kV 0.0 5.5 27.3 14
44kV class gt36kV to lt44kV 44kV class gt36kV to lt44kV 0.0 0.5 6.5 14
Installed MVA Capacity per 1000 Customers Distribution Installed MVA Capacity per 1000 Customers Distribution Installed MVA Capacity per 1000 Customers Distribution 10.06 18.02 63.24 11
Average Substation Transformer Loading Distribution Average Substation Transformer Loading Distribution Average Substation Transformer Loading Distribution 28 52 91 10
Percent of Switches outside the substation remotely operated Percent of Switches outside the substation remotely operated Percent of Switches outside the substation remotely operated 0 11 62 11
Financial - Demographics Financial - Demographics Financial - Demographics Financial - Demographics
Distribution Substation Assets per MVA Distribution Substation Assets per MVA Distribution Substation Assets per MVA 7,902 34,744 60,146 11
8
Transmission Substations Demographic Profile
Min Mean Max of Bars
Demographics Transmission Demographics Transmission Demographics Transmission Demographics Transmission Demographics Transmission
Transmission Substations per 100 Transmission structure miles Transmission Substations per 100 Transmission structure miles Transmission Substations per 100 Transmission structure miles 0.50 2.74 12.36 10
Transmission Substation Transformer Banks by Voltage Transmission Substation Transformer Banks by Voltage Transmission Substation Transformer Banks by Voltage
lt69kV class Subs lt69kV class Subs 0.0 0.1 1.6 13
69kV class Subs 69kV class Subs 0.0 30.5 78.2 13
100kV class Subs 100kV class Subs 9.2 48.0 100.0 13
200kV Class Subs 200kV Class Subs 0.0 7.9 27.0 13
300kV Class Subs 300kV Class Subs 0.0 2.3 29.4 13
400kV Class Subs 400kV Class Subs 0.0 11.2 63.9 13
Installed MVA Capacity per 1000 Customers Transmission Installed MVA Capacity per 1000 Customers Transmission Installed MVA Capacity per 1000 Customers Transmission 7.93 17.66 31.68 10
Average Substation Transformer Loading Transmission Average Substation Transformer Loading Transmission Average Substation Transformer Loading Transmission 29 59 78 8
Financial - Demographics Financial - Demographics Financial - Demographics Financial - Demographics Financial - Demographics
Transmission Substation Assets per MVA Transmission Substation Assets per MVA Transmission Substation Assets per MVA Transmission Substation Assets per MVA 17,027 48,193 131,477 11
9
Substation Definitions
- FERC provides definitions on what constitutes a
Transmission vs. Distribution substation based
upon use. - For multipurpose substations, FERC allows either
segregating costs, or assigning based upon
predominant use. - For purposes of this survey, we generally will
recommend a low side definition based upon a 45kV
or below as a distribution substation. - We understand that a typical Canadian practice
would be to define a substation based upon high
side voltage (e.g. 115kv to 12kv stations are
defined as transmission). Based upon predominant
use, these still can be classified as
transmission substations. - It is unrealistic to ask utilities to redefine
their cost or reliability reporting on the basis
of these definitions. We will rely on each
utilitys self-assigned definitions. However, a
utility that has very different definitions may
want to restate these statistics to better
compare their performance.
Distribution Voltage Classes 5kV (gt1kV,
lt9kV) 15kV (gt9kV, lt15kV) 25kV (gt15kV,
lt26kV) 35kV (gt26kV, lt36kV) 44kV )gt36kV, lt48kV)
Transmission Voltage Classes lt69kV 69kV class
(gt69kV lt100kV) 100kV class (gt100kV
lt200kV) 200kV Class (gt200kV lt300kV) 300kV Class
(gt300kV lt400kV) 400kV and above
- Note We will have transmission-only and
distribution-only entities participating in this
survey. Undoubtedly their voltage levels will not
necessarily line-up with the above definitions.
10
2014 TD Statistics DISTRIBUTION SUBSTATION
TRANSFORMER BANKS BY VOLTAGE LEVEL
Comments
Calculation used ST80.2 / (Dist Transformer
Banks) 100 , ST80.1 / (Dist Transformer Banks)
100 , ST80.3 / (Dist Transformer Banks) 100 ,
ST80.4 / (Dist Transformer Banks) 100 , ST80.5
/ (Dist Transformer Banks) 100
11
2014 TD Statistics TRANSMISSION SUBSTATION
TRANSFORMER BANKS BY VOLTAGE
Comments
Calculation used ST85.3 / (Trans Transformer
Banks) 100 , ST85.2 / (Trans Transformer Banks)
100 , ST85.4 / (Trans Transformer Banks) 100
, ST85.5 / (Trans Transformer Banks) 100 ,
ST85.6 / (Trans Transformer Banks) 100 , ST85.1
/ (Trans Transformer Banks) 100
12
2014 TD Statistics INSTALLED MVA CAPACITY
DISTRIBUTION
Mean Quartile
Mean 18.02
Quartile 1 12.70
Quartile 2 13.58
Quartile 3 14.77
Comments
Calculation used ST100.1 / ( (ST5_TD Dist End
Use Customers) / 1000 )
13
2014 TD Statistics INSTALLED MVA CAPACITY
TRANSMISSION
Mean Quartile
Mean 17.66
Quartile 1 11.75
Quartile 2 16.85
Quartile 3 22.18
Comments
Calculation used ST105.1 / ( (ST5_TD Dist End
Use Customers) / 1000 )
14
2014 TD Statistics AVERAGE SUBSTATION
TRANSFORMER LOADING AT PEAK DISTRIBUTION
Mean Quartile
Mean 52
Quartile 1 49
Quartile 2 51
Quartile 3 56
Comments
Calculation used ST100.5
15
2014 TD Statistics AVERAGE SUBSTATION
TRANSFORMER LOADING AT PEAK TRANSMISSION
Mean Quartile
Mean 59
Quartile 1 46
Quartile 2 62
Quartile 3 74
Comments
Calculation used ST105.5
16
2014 TD Statistics ANALYSIS TD PLANT IN
SERVICE PER DISTRIBUTION END-USE CUSTOMER FERC
Mean Quartile
Mean 4,648
Quartile 1 4,057
Quartile 2 4,769
Quartile 3 4,927
Comments This graph does not represent a
performance measure, but instead is used for data
validation and analysis.
24, 34 did not include Transmission expenses and
will not be shown on subsequent slides.
Calculation used ( DF70.1 ) / (ST5_TD Dist End
Use Customers) , ( DF70.2 TF65.2 ) / (ST5_TD
Dist End Use Customers) , TF65.1 / (ST5_TD Dist
End Use Customers)
17
2014 TD Statistics ANALYSIS TD SUBSTATION
PLANT IN SERVICE PER INSTALLED MVA
Mean Quartile
Mean 39,936
Quartile 1 28,810
Quartile 2 34,778
Quartile 3 49,300
Comments
Calculation used DF70.2 / ( ST100.1 ST105.1 ) ,
TF65.2 / ( ST100.1 ST105.1 )
18
2014 TD Statistics ANALYSIS DISTRIBUTION
SUBSTATION PLANT IN SERVICE PER INSTALLED MVA
Mean Quartile
Mean 34,744
Quartile 1 44,242
Quartile 2 32,630
Quartile 3 27,128
Comments This graph does not represent a
performance measure. It is used for analysis.
Calculation used DF70.2 / ST100.1
19
2014 TD Statistics PERCENT OF DISTRIBUTION
CIRCUITS REMOTELY OPERATED
Comments
Calculation used ST110.1
20
2014 TD Statistics PERCENT OF SWITCHES OUTSIDE
THE SUBSTATION REMOTELY OPERATED
Comments
Calculation used ST110.2
21
We ask for several measures of System Activity
22
2014 TD System Activity SUBSTATION MVA ADDED
Distribution
Transmission
Calculation used SA40.4A / ST100.1 100 ,
SA40.6A / ST100.1 100 , SA45.4A / ST100.1 100
, SA45.6A / ST100.1 100
23
Financial Overview of the Cost Model
- Working with an adjusted FERC model
24
TD Substation Cost Profile
2013YE 2013YE 2013YE 2013YE 2013YE 2012YE 2012YE 2012YE 2012YE 2012YE
Mean Q1 Q2 Q3 of Bars Mean Q1 Q2 Q3 of Bars
OM Cost OM Cost OM Cost
Substation OM per Customer Substation OM per Customer 13.47 7.94 13.47 14.64 15 16.56 8.42 11.75 15.05 17
Distribution Substation OM per Customer 8.40 3.78 5.99 13.75 14 7.07 3.39 6.19 11.00 17
Substation OM per Installed MVA Substation OM per Installed MVA 492 267 353 483 12 544 308 543 802 14
Transmission Substations OM per MVA 442 205 326 614 11 489 217 436 681 12
Distribution Substations OM per MVA 516 235 345 501 10 1,419 274 502 703 14
Substation OM per Total Assets Substation OM per Total Assets 1.23 0.87 1.18 1.47 16 1.23 0.94 1.17 1.40 17
Transmission Substations per Asset 0.91 0.57 0.95 1.08 13 1.13 0.76 1.07 1.16 15
Distribution Substations per Asset 1.45 0.74 1.29 2.24 14 1.36 0.76 1.13 1.83 17
Investment Rate Investment Rate Investment Rate
Substation Capital Spending less New Subs per Asset Activity Based Substation Capital Spending less New Subs per Asset Activity Based 7.24 10.45 5.59 3.82 13 5.44 6.41 4.25 2.63 15
Distribution Substations Replacement Rate 5.07 5.55 5.19 3.24 11 3.93 5.13 3.38 2.19 14
Transmission Substations Replacement Rate 8.23 13.04 5.27 4.13 12 6.38 7.17 5.26 3.19 14
25
Financial Overview of the Cost Model
- Working with an adjusted FERC model
- and the
- Activity-Based Cost Model
26
Activity-Based Cost Model
2014 Guidelines
- The activity-based cost model breaks the
expenditures into capital and OM, and then
splits them into the activities shown on the
process model introduced above. The following 3
pages provide more details of the individual
activities for Transmission, Substations, and
Distribution.
- Transmission Line Capital
- Serve New
- Expand
- Sustain
- Other
- CIAC
- TD Substation Capital
- Serve New
- Expand
- Sustain
- Other
- CIAC
- Distribution Line Capital
- Serve New
- Expand
- Sustain
- Other
- CIAC
- Distribution Line OM
- Sustain
- Other
- TD Substation OM
- Sustain the Network
- Operate the Network
- Other
- Transmission Line OM
- Sustain the Network
- Operate the Network
27
Activity Based Costs - Substations
2014 Guidelines
- While capital expenditures are split among
several different processes from the overall
process model, OM expenses are almost entirely
associated with sustaining the network.
- TD Substation Capital
- Serve New New Substations and new substation
capacity to serve specific new customer requests - Expand Capacity Additions to meet generic load
growth - Sustain Repair/replace-in-kind
- Sustain system improvement (reliability/efficien
cy, system hardening, physical security) - Sustain Service Restoration
- Sustain Mobile/Spare Transformer Purchases
- Other
- CIAC
- TD Substation OM
- Inspection Maintenance
- Service Restoration
- Distribution Operations Center
- Engineering/Design OM (Planning studies,
standards, mapping) - Other
28
2014 TD TD Substation Financials TD
SUBSTATION CAPITAL SPENDING PER ASSET FERC
Mean Quartile
Mean 10.0
Quartile 1 7.5
Quartile 2 4.9
Quartile 3 4.7
28 reported all costs as transmission total is
correct but components will be excluded from
T-Sub slides.
Calculation used DF10.5 / ( DF70.2 TF65.2 )
100 , TF10.5 / ( DF70.2 TF65.2 ) 100
29
2014 TD Dist Substation Financials DISTRIBUTION
SUBSTATION OM CAPITAL SPENDING PER ASSET FERC
Mean Quartile
Mean 5.9
Quartile 1 3.7
Quartile 2 4.7
Quartile 3 7.4
Comments Some companies are distribution only or
transmission only, only a few are TD combined.
24 reported very little OM expense
Calculation used DF30.5 / DF70.2 100 , DF10.5 /
DF70.2 100
30
Distribution SubstationFinancial Overview of
the Cost Model
- Working with an adjusted FERC model
31
2014 TD Dist Substation Financials DISTRIBUTION
SUBSTATION CAPITAL SPENDING PER ASSET ACTIVITY-
BASED V.14
Mean Quartile
Mean 6.28
Quartile 1 7.84
Quartile 2 5.56
Quartile 3 4.92
Comments
Calculation used DF55.1 / DF70.2 100 , DF55.2 /
DF70.2 100 , DF55.3 / DF70.2 100 , DF55.4 /
DF70.2 100 , DF55.5 / DF70.2 100 , DF55.6 /
DF70.2 100 , DF55.7 / DF70.2 100
32
2014 TD Dist Substation Financials DISTRIBUTION
SUBSTATION CAPITAL SPENDING EX SERVE NEW, EXPAND
PER ASSET ACTIVITY-BASED V.14
Mean Quartile
Mean 3.40
Quartile 1 4.51
Quartile 2 2.88
Quartile 3 2.24
Comments
Calculation used 1 / ( DF55.1 - DF55.1 ) , 1 / (
DF55.2 - DF55.2 ) , DF55.3 / DF70.2 100 ,
DF55.4 / DF70.2 100 , DF55.5 / DF70.2 100 ,
DF55.6 / DF70.2 100 , DF55.7 / DF70.2 100
33
2014 TD Dist Substation Financials DISTRIBUTION
SUBSTATION CAPITAL SPENDING PER CUSTOMER
ACTIVITY-BASED V.14
Mean Quartile
Mean 32.75
Quartile 1 38.89
Quartile 2 33.47
Quartile 3 26.37
Comments
Calculation used DF55.1 / (ST5_TD Dist End Use
Customers) , DF55.2 / (ST5_TD Dist End Use
Customers) , DF55.3 / (ST5_TD Dist End Use
Customers) , DF55.4 / (ST5_TD Dist End Use
Customers) , DF55.5 / (ST5_TD Dist End Use
Customers) , DF55.6 / (ST5_TD Dist End Use
Customers) , DF55.7 / (ST5_TD Dist End Use
Customers)
34
2014 TD Dist Substation Financials DISTRIBUTION
SUBSTATION CAPITAL SPENDING EX SERVE NEW PER
DEPRECIATION EXPENSE ACTIVITY- BASED V.14
Mean Quartile
Mean 248.71
Quartile 1 331.12
Quartile 2 190.57
Quartile 3 161.50
0 200 400
600
Comments
Calculation used 1 / ( DF55.1 - DF55.1 ) , DF55.2
/ DF80.2 100 , DF55.3 / DF80.2 100 , DF55.4 /
DF80.2 100 , DF55.5 / DF80.2 100 , DF55.6 /
DF80.2 100 , DF55.7 / DF80.2 100
35
2014 TD Dist Substation Financials OTHER
ACTIVITY BASED COSTS DISTRIBUTION SUBSTATION
CAPITAL SPENDING
Calculation used DF56.1
ID Response
31 Capital Tools, RD, Premise Equipment, Facilities
33 not applicable
23 NA
38 Environmental/Legislative/Regulatory Environmental/Legislative/Regulatory
24 Not applicable
21 Customer Orders, General Plant, Normal Ops, and Meters/Xfmrs
30 N/A
27 Environmental
32 Not applicable
36
2014 TD Dist Substation Financials DISTRIBUTION
SUBSTATION OM EXPENSE PER ASSETS
ACTIVITY-BASED V.14
Mean Quartile
Mean 1.42
Quartile 1 0.74
Quartile 2 1.11
Quartile 3 2.13
Comments
34 reported high service restoration
costs 34, 40 high other
Calculation used DF65.1 / DF70.2 100 , DF65.2 /
DF70.2 100 , DF65.3 / DF70.2 100 , DF65.4 /
DF70.2 100 , DF65.5 / DF70.2 100
37
2014 TD Dist Substation Financials DISTRIBUTION
SUBSTATION OM EXPENSE PER CUSTOMER ACTIVITY-
BASED V.14
Mean Quartile
Mean 8.02
Quartile 1 3.77
Quartile 2 5.05
Quartile 3 12.06
Comments
Calculation used DF65.1 / (ST5_TD Dist End Use
Customers) , DF65.2 / (ST5_TD Dist End Use
Customers) , DF65.3 / (ST5_TD Dist End Use
Customers) , DF65.4 / (ST5_TD Dist End Use
Customers) , DF65.5 / (ST5_TD Dist End Use
Customers)
38
2014 TD Dist Substation Financials OTHER
ACTIVITY BASED COSTS DISTRIBUTION SUBSTATION OM
Calculation used DF66.1
ID Response
31 Training and RD
33 not applicable
23 VM including mowing and landscape.
38 na
24 Not applicable
21 OM associated with New Customers and Construction
30 N/A
27 Administration, Landscape Maint, Order Material, Inspections, Rodent Proofing
34 Substation training staff
32 Not applicable
39
2014 TD Dist Substation Financials CWIP AS A
OF CAPITAL EXPENDITURES - DISTRIBUTION SUBSTATION
Mean Quartile
Mean 118.9
Quartile 1 31.9
Quartile 2 55.7
Quartile 3 135.8
Comments
Calculation used DF85.2 / DF10.5 100
40
2014 TD Dist Substation Financials FERC VS
ACTIVITY SPENDING DISTRIBUTION SUBSTATION OM
PER ASSET V.14
Comments
22, 24,25 did not report activity cost
Calculation used DF30.5 / DF70.2 100 ,
(DF65_ABC Dist Sub OM v.14) / DF70.2 100
41
2014 TD Dist Substation Financials FERC VS
ACTIVITY SPENDING DISTRIBUTION SUBSTATION
CAPITAL PER ASSET V.14
Comments
Calculation used DF10.5 / DF70.2 100 ,
(DF55_Dist Subs Cap ABC v.14) / DF70.2 100
42
2014 TD Dist Substation Financials DEPRECIATION
EXPENSE AS A PERCENT OF ASSETS DISTRIBUTION
SUBSTATIONS
Mean Quartile
Mean 2.20
Quartile 1 1.81
Quartile 2 2.25
Quartile 3 2.55
Comments
Calculation used DF80.2 / DF70.2 100
43
Distribution Substation Capital Spending
2013 saw an increased spending level
2010YE Q2 2011YE Q2 2012YE Q2 2013YEQ2
Total Capital 5.5 4.5 4.24 5.56
Less Serve New 1.9 0.8 2.07 0.37
Subtotal Sustain Cap Adds 3.6 3.7 2.17 5.19
Less Capacity Adds 1.4 1.6 0.08 2.31
Subtotal Sustain 2.2 2.1 2.09 2.88
43
44
Transmission sub Financial Overview of the
Cost Model
Panels exclude D-only companies
45
2014 TD Trans Substation Financials TRANSMISSION
SUBSTATION OM CAPITAL SPENDING PER ASSET
FERC
Mean Quartile
Mean 7.0
Quartile 1 5.8
Quartile 2 6.6
Quartile 3 8.7
Comments Some companies are distribution only or
transmission only, only a few are TD combined.
Calculation used TF30.5 / TF65.2 100 , TF10.5
/ TF65.2 100
46
2014 TD Trans Substation Financials TRANSMISSION
SUBSTATION CAPITAL SPENDING PER ASSET
ACTIVITY-BASED V.14
Mean Quartile
Mean 7.41
Quartile 1 11.50
Quartile 2 5.60
Quartile 3 3.83
Comments
Calculation used TF50.1 / TF65.2 100 , TF50.2
/ TF65.2 100 , TF50.3 / TF65.2 100 , TF50.1
/ TF65.2 100 , TF50.5 / TF65.2 100 , TF50.4 /
TF65.2 100 , TF50.6 / TF65.2 100
47
2014 TD Trans Substation Financials TRANSMISSION
SUBSTATION CAPITAL SPENDING EX SERVE NEW, EXPAND
PER ASSET ACTIVITY- BASED V.14
Mean Quartile
Mean 2.80
Quartile 1 4.12
Quartile 2 2.37
Quartile 3 1.19
Comments
Calculation used 1 / ( TF50.1 - TF50.1 ) , 1 / (
TF50.2 - TF50.2 ) , TF50.3 / TF65.2 100 ,
TF50.1 / TF65.2 100 , TF50.5 / TF65.2 100 ,
TF50.4 / TF65.2 100 , TF50.6 / TF65.2 100
48
2014 TD Trans Substation Financials OTHER
ACTIVITY BASED COSTS TRANSMISSION SUBSTATIONS
CAPITAL SPENDING
Calculation used TF51.1
ID Response
31 Capital Tools, RD, Premise Equipment, Facilities
33 not applicable
23 NA
38 Environmental/Legislative/Regulatory
24 not applicable
21 n/a
30 N/A
27 Substation security
32 Not applicable
49
2014 TD Trans Substation Financials TRANSMISSION
SUBSTATION OM EXPENSE PER ASSETS
ACTIVITY-BASED V.14
Mean Quartile
Mean 0.90
Quartile 1 0.57
Quartile 2 0.96
Quartile 3 1.06
Comments
40 has high sub operations expense
Calculation used TF60.1 / TF65.2 100 , TF60.2
/ TF65.2 100 , TF60.1 / TF65.2 100 , TF60.1 /
TF65.2 100 , TF60.3 / TF65.2 100
50
2014 TD Trans Substation Financials CWIP AS A
OF CAPITAL EXPENDITURES - TRANSMISSION SUBSTATION
Mean Quartile
Mean 80.1
Quartile 1 25.2
Quartile 2 48.5
Quartile 3 115.4
Comments
Calculation used TF80.2 / TF10.5 100
51
2014 TD Trans Substation Financials FERC VS
ACTIVITY SPENDING TRANSMISSION SUBSTATION OM
PER ASSET V.14
Comments
25,359,37 Did not report T-Sub Activity OM 21
Activity gtgtFERC
Calculation used TF30.5 / TF65.2 100 ,
(TF60_ABC Trans Sub OM v.14) / TF65.2 100
52
2014 TD Trans Substation Financials FERC VS
ACTIVITY SPENDING TRANSMISSION SUBSTATION
CAPITAL PER ASSET V.14
Comments
25,37 did not report activity
Calculation used TF10.5 / TF65.2 100 ,
(TF50_ABC Trans Subs Cap v14) / TF65.2 100
53
2014 TD Trans Substation Financials DEPRECIATION
EXPENSE AS A PERCENT OF ASSETS TRANSMISSION
SUBSTATION
Mean Quartile
Mean 2.01
Quartile 1 1.90
Quartile 2 2.06
Quartile 3 2.21
Comments
Calculation used TF75.2 / TF65.2 100
54
Transmission Substations Capital Spending
2013 saw a slightly reduced level of transmission
substation overall spending, but an increase in
sustain activity.
2010YE Q2 2011YE Q2 2012YE Q2 2013YEQ2
Total Capital 7.0 7.9 6.16 5.74
Less Serve New 1.6 0.7 1.12 0.47
Subtotal Sustain Cap Adds 5.4 7.2 5.04 5.27
Less Capacity Adds 2.9 3.8 3.14 2.16
Subtotal Sustain 2.5 3.4 1.90 3.11
54
55
SubstationPractices and Initiatives
56
AGING ASSETS A PROBLEM FOR ASSET MANAGERS
- Aug 11, 2014
- TD World magazine conducted the expansive
research, collecting data from June 5-9, 2014,
and 685 respondents representing TD managers and
engineers working in construction, maintenance,
operations and engineering. The report looks at
all the of the main issues professionals are
facing including aging assets, equipment and
technology investments, upgrading capacity vs.
lessening susceptibility, power delivery system
redesign plans. Some interesting statistics - The majority are investing in diagnostic
equipment (66), while 52 are installing outage
management systems. Far fewer are looking at
self-healing circuits (21). - A third of respondents (34) report their
utilities are planning to redesign their power
delivery systems within the next two years to
accommodate distributed generation, including 16
who plan to do so within the next year. - Respondent attitudes are divided with regard to
whether or not it would make sense for their
utilities to support the development of hybrid
microgrids in order to take congestion off the
utility grid while meeting local interests in
being more independent 28 believe this would
make sense for their utilities, 35 believe it
may, and 37 are doubtful. - Just under a third of respondents (29) expressed
a healthy interest in learning more about
compliance with FERC Order 1000, which enables
companies to compete against incumbent utilities
and bid to deliver turnkey transmission to meet
ISO requested transmission. Another 31 are
moderately interested.
57
Potential for Terrorist Attack
The U.S. could suffer a coast-to-coast blackout
if saboteurs knocked out just nine of the
country's 55,000 electric-transmission
substations on a scorching summer day, according
to a previously unreported federal analysis.
Gunmen attacked transformers at PGE's Metcalf
substation near San Jose, Calif., last year,
putting it out of service for almost a month.
Talia Herman for The Wall Street Journal
58
A Process Model for Managing the Network
Respond to Emergencies
Add New Customers
Sustain Network
Expand Network
Operate Network
Project/Portfolio Management
Develop and Approve Asset Plans
Develop Network Strategy
59
Substation Practices/initiatives section
- 2013 Sections
- Asset Management RCM and Life cycle costing
approaches replacement programs, and problematic
equipment - Planning/Engineering/Design Changes to standards
- Substation Automation Technology and
initiatives underway - Job Estimating Software tools and role of
construction - Mobiles/Spares Deployment of mobiles and spare,
and optimization techniques - Field Maintenance Activities Initiatives
underway, degree of crew specialization, and
work management systems - NERC Maintenance Standards Impact of NERC
standards on substation maintenance - Maintenance Inspections, impact of deferred
maintenance, initiatives to reduce outages
- 2014 Proposed by Process
- Asset Management
- Strategy
- Substation automation
- Mobile spares
- Sustain Substations
- Maintenance planning
- Field maintenance
- Including NERC standards
- Replacement/upgrades
- Expand Substations
- Planning/Engineering/Design
- Job estimating
- Field Construction
60
Substation practice Questions
- 2014 Proposed by Process
- Asset Management
- Strategy
- Substation automation
- Mobile spares
- Sustain Substations
- Maintenance planning
- Field maintenance
- Including NERC standards
- Replacement/upgrades
- Expand Substations
- Planning/Engineering/ Design
- Job estimating
- Field Construction
- Asset Management (AM)
- Role of the Asset Management organization in
decision -making - Key responsibilities of the Substation AM
organization - What keeps you up at night worrying about your
system - Analytic approaches used to predict replacement
needs - Use of concepts embodied in RCM in Subs
- Use of the concepts embodied in 'Life Cycle
Costing' - Use predictive reliability analysis tools on
component failure rates - Replacement Programs Underway Power
Transformers Switch Gear Circuit Breakers
Relays Instrument Transformers
Secondary/Communications - Classes of equipment that are becoming
problematic - Other Classes of equipment that are becoming
problematic - Use of dedicated software tools to support
substation AM
61
1QC Industry PerspectiveSubstations
62
Key Success FactorsManage assets
63
2014 TD Substations WHAT KEEPS YOU UP AT NIGHT
WORRYING ABOUT YOUR SYSTEM
ID Response
31 Knowledge Transfer and the development of field personnel continues to be a major problem as the tenured work force leaves.
28 Safety, theft, our ability to manage the reliability of all the software/firmware/settings associated with microprocessor control equipment.
33 Trans bank failures, relay misoperations
37 Aging infrastructure coupled with limited resources to address
38 Maintaining a good maintenance program AND meeting OM targets.
40 Older equipment (Reliability) and lack of spare parts or vendor support. Electromechanical relays.
24 The increasing age, deteriorating condition, and decreasing reliability of several classes of equipment in the system - despite continuing efforts at cost effective Condition Based Maintenance (CBM).
21 Aging equipment
30 Substations without internal T- line protection, aging infrastructure, incomplete and inaccurate asset history and maintenance data
27 Aging equipment, EHV transformer failure, large customers with single source transformer
359 Aging assets and unexpected failures.
32 Loss of AY autobank or RR autobank 1 until new RR autobank 2 is in service
Calculation used SP10.1
64
2014 TD Substations ANALYTIC APPROACHES USED TO
PREDICT REPLACEMENT NEEDS
ID Response
22 Condition health assesment in Cascade
31 Condition/operational monitoring, equipment history, environment issues
28 MTBF (mean time between failures) is a key metric . Our Sustain Investment Model looks at groups of assets, anticipated lifetimes, historical performance to determine an evergreen investment program over multiple decades.
33 Using cascade we've identified replacement criteria by asset category. We use manufacture recommendations and industry standards
23 Failure history, performance, maintenance requirements and grid criticality.
37 Past failure trending, industry benchmarking and trending, trending of test data
38 Proprietary models by equipment class to determine replacement order.
40 Costs, trips per line, age of equipment, availability of spare parts and support. Infrared, test results.
21 Data from worst performing circuits, track failure rates by equipment types and cause. We are developing a risk based maintenance strategy to drive replacement needs that will take into consideration probability of failure (health), consequence of failure (criticality) and life cycle costing considerations.
30 Transformer criticality spreadsheet that factors in customer base, average loading, emergency ties, and transformer DGA test results. We take historical hazard/survival rates for each particular asset classification into consideration when determining overall operational risk to the organization
27 Power factor testing, DGA, and trends of like equipment.
359 For long range planning, look at population models and how the age is varying with time. For individual components, use health index and criticality of the asset.
32 Mean time between failures, life expectancy, fleet analysis, previous inspection findings (eg wood pole test/treat reject rates). TRANS - 1) DGA 2) Doble test, megger test, etc. 4) Difficulty in buying replacement parts 5) Maintenance history
Calculation used SP15.1
65
2014 TD Substations ANALYTIC APPROACHES USED TO
PREDICT REPLACEMENT NEEDS
PSEG
24 Our Computerized Maintenance Management System (CMMS) provides the means for optimizing the maintenance of our assets through the use of condition - based tools. It is a decision support system that assists in making repair/replace/maintain decisions. The CBM implementation strategy through CMMS requires the comprehensive integration of data from multiple systems. These systems include but are not limited to OMSto gather weekly inspection data, delivery work management (DWMS) to gather diagnostic data collection from field personnel, system and equipment operational data, equipment test data, and on - line equipment monitoring data. This system utilizes available information on equipment health by incorporating it into the maintenance decision process. Algorithms have been set up to provide ranking systems for all major equipment. The algorithm factors are based on the data available for each particular asset, and the factor weightings vary between voltage classes. The Action Algorithms provide a score for each asset, with those most in need of review and/or action scoring the highest. Replacement Algorithms are used to help identify equipment advancing towards completion of useful life. The algorithms are periodically reviewed and adjusted to keep them on track in identifying equipment maintenance needs.
66
2014 TD Substations USE OF CONCEPTS EMBODIED IN
'RELIABILITY CENTERED MAINTENANCE' IN SUBSTATIONS
ID Response
22 Maintenance tempaltes use failure modes to determine appropriate PM taslks
31 Set frequencies of maintenance, required test performed
28 We use function, criticality, and condition monitoring to establish our maintenance programs.
33 we look at equip category failure history by manufacture, age, duty cycle to help predict future replacement criteria.
23 Targeting worse performers, reviewing failure modes and customer impacts and the risk to grid on run to failure scenarios.
37 Gone to condition base versus time based maintenance on some assets. Adjusted maintenance intervals and tasks based on performance. Prioritized spending on maintenance
38 Monitor critical parameters and replace the worst first. Use equipment condition wherever possible.
40 Specific reads on inspection triggers
21 Used to determine the proper maintenance strategy for assets. In addition, used to drive some equipment upgrades and/or reliability improvement projects. We are not heavily involved in RCM currently.
27 Criticality, impact, failure modes, cost of assets used to determine maintenance cycles
359 For replacement strategy, look at multiple inputs to make decisions, not just one, such as age
67
USE OF CONCEPTS EMBODIED IN 'RELIABILITY CENTERED
MAINTENANCE' IN SUBSTATIONS
PSEG
24 Reliability Centered Maintenance (RCM), or Condition - Based Maintenance (CBM), is a proactive equipment maintenance capability that uses system health indications to identify and predict functional failure in advance of the event and provide the ability to take appropriate preventive action. This approach to maintenance uses data drawn during operations and/or maintenance intervals to forecast the need for additional or future maintenance. It extends the concepts of predictive maintenance by using data from maintenance tests. Ideally condition - based maintenance will allow maintenance personnel to locate and resolve asset functionality issues before they escalate, minimizing corrective maintenance costs and system downtime.
32 TRANS - All major eqipment is routinely maintained on a time based system. Maintenance intervals are based on a combination of generally accepted industry practice, performance history, age of equipment, and to some degree the criticality of the equipment. Nonroutine maintenance is performed as required.
68
2014 TD Substations USE PREDICTIVE RELIABILITY
ANALYSIS
Calculation used SP30.1
ID Response
31 TORT - Transmission operational data
28 Yes, Asset Health Index (AHI) and Strategic Asset Management (SAM) tools part of the EPS - M UtiliCase.
33 no
23 We track SAIDI, SAIFI, CAIDI as they relate to transmission line,station and feeder performance. We analyze each incident that we encounter and search for the problem as a part of our equipment failure reporting in an attempt to identify and share failure modes and equipment issues that need to be addressed on other infrastructure of the same type.
38 Key metrics are used to verify effectiveness of improvement projects.
40 We use SAIFI and SAIDI that helps us to predict and determine reliability issues on our transmission lines and helps to determine replacement priorities.
24 Component failure rate information (as available) is used to recommend budgetary needs for equipment replacements required to maintain system reliability. Specific candidates for equipment replacement are determed by condition assessment review. Substation design philosophy includes redundancy and reliability considerations to minimize impact of Substation equipment failures on customer reliability metrics such as SAIFI and CAIDI.
21 Not sure what you are looking for with this question.
69
2014 TD Substations USE OF DEDICATED SOFTWARE
TOOLS TO SUPPORT SUBSTATION ASSET MANAGEMENT
Calculation used SP45.1
ID Response
22 Cascade
31 Davies AIS tool for investment prioritization. SAP/BI for asset life cycle analytics.
33 digital inspections, cascade, 4 years, full inventory, and complete maintenance functionality.
23 Maximo 7.5 since May 2013. Asset warehouse maintenance system.
37 Maximo - last updated in 2009 provides asset tracking and cost analysis
38 '1) TOA(Transformer Oil Analysis) Delta X Research 16 years
40 CASCADE - Tracks maintenance tasks results and history of equipment.
21 Cascade 2 - 1/2 years, Powerbase 6 months
30 EMPAC (Indus) 1994
27 We have used Maximo by IBM for 2 years. It holds are maintenance records is work manangement
359 Digital Inspections - CASCADE 3.31, Substation and LTN Inventory and Preventative Maintenance Management.
32 TRANS - MAXIMO used for creating and storing job plans, test data. Automatically generates work orders for all time based maintenance activities. Any unscheduled maintenance is planned through MAXIMO and records kept.
70
USE OF DEDICATED SOFTWARE TOOLS TO SUPPORT
SUBSTATION ASSET MANAGEMENT
28 1) NERC Audit Report, in - house, 4 years, Management of work orders, schedule, compliance. 2) EPS - M (Utili - Case), 5 years, Asset Analytics, Asset Information, Asset Performance, Algorithms used to provide the 30 years System Investment Management profile, and Reporting. 3) Asset Health Index (AHI), 10 years, Report provides full of results data on the condition and estimated remaining life of assets in the BC Hydro transmission and distribution system (TD), including substation assets (Stations). 4) Asset Needs and Risk Register (in -house), 2 years, integrated planning and risk register tool for both long -term (20 -30 years) and short - term (2- 10 years) assets/system needs.
24 The CMMS system discussed in SP15 is an internally developed software platform that is used to integrate data from multiple sources and apply internally generated condition assessmemnt algorithms to rank all assets in terms of need for maintenance and/or replacement. The sources include characterisitic and cost information from SAP, loading and other system condition data maintained in a PI historical data warehouse, weekly inspection data input from hand - held mobile devices, on- line monitoring devices (such as gas - in - oil monitors for transformers), and laboratory diagnostic field test databases maintained by our Test Laboratory.
71
2014 TD Substations SUBSTATION STANDARDS
CHANGED RECENTLY AND WHY
ID Response
31 Meet with user groups to identify required standards needs
28 Planning, Design, and Commissioning standards have changed recently to provide consistency with third party service providers and alignment with Safety - by - Design principles.
33 Complete standards revision began in 2013 for update our maintenance practices.
37 Application of substation safety signs to comply with latest version of ANSI/NESC. Relay standards updated Capacitor Protection guide, Alarm guide, Cyber security guide. Breaker standard updated to include magnetic actuators (new technology for us) and battery standard updated per periodic review
40 Relay Maint. and Const. for updated supplements to PRC - 005 of 001b, 002, and 003. Updated transformer and breaker specifications Protection System Maintenance Plan
21 Transformers, SF6 Breakers
30 None
72
SUBSTATION STANDARDS CHANGED RECENTLY AND WHY
27 We require our 13.8kV switchgear to be arc resistant type 2B rated for increased crew safety while racking the breakers in and out. We added card readers to PDC buildings and added building access, building temperature and fire alarms to our SCADA system to better monitor and control building access and decrease response time in the event of a fire. We automated the drive - through gate with card reader control at new substations with the open and closed positions reported to SCADA to monitor and control access to the substation. We also install a manual locked man gate to be used if the automated gate does not operate. We revised our transformer specifications to inlcude transformer monitioring equipment from Dynamics Ratings
359 We are in the process of 'overhauling' all of our Standards for Transmission and Substations. Currently we revised the 230/69 kV entire substation standard and created a manual. The manual consist of Standard design intent, design criteria, relay design intent, relay and control acceptable devices and protection requirements, Construction work and bid template and testing and commissioning requirements. This manual will be a model to be used when doing the 500 and 69/12 kV substations, which we intend to have done by the end of the year. We are also updating our entire grounding standards for all substations. We have also updated our equipment specifications to include more industry proven devices that will help move us from time based maintenance to a condition based maintenance approach. For instance we now require on - line DGA devices to eliminate employees from taking samples every 6 months on our transformers. We are also using bushing monitoring devices for our transformers to move away from Doble testing.
73
2014 TD Substations IDENTIFY ANY SOFTWARE
PRODUCTS USED OR BEING EVALUATED FOR SUBSTATION
JOB ESTIMATING
Calculation used SP60.1
ID Response
22 None
31 Internally developed excel spreadsheets
28 We are currently using Excel for estimating and _at_Risk for Monte- Carlos analysis. We are also evaluating ???U.S Cost?? and HeavyBid estimating software for future use.
33 in house estimating program
23 Spreadsheets and in house software tool.
37 Maximo and Business Objects
38 none
40 Maximo Excel
21 Cascade
30 Excel
27 Microsoft Excel
359 Excel Bulk Power Estimator (internally developed tool)
32 No Software
74
Key Success FactorsMaintenance programs
75
2014 TD Substations
Power Transformers 87
Switch Gear 67
Circuit Breakers 93
Relays 80
Instrument Transformers 60
SecondaryCommunications 60
Other 40
Calculation used SP35.1 , SP35.2 , SP35.3 ,
SP35.4 , SP35.5 , SP35.6 , SP35.7 Legends
Power Transformers
?
?
?
?
?
?
?
?
?
?
?
?
?
Switch Gear
?
?
?
?
?
?
?
?
?
?
Circuit Breakers
?
?
?
?
?
?
?
?
?
?
?
?
?
?
Relays
?
?
?
?
?
?
?
?
?
?
?
?
Instrument Transformers
?
?
?
?
?
?
?
?
?
SecondaryCommunications
?
?
?
?
?
?
?
?
?
Other
?
?
?
?
?
?
76
Partial Table
SUBSTATION REPLACEMENT
77
SubstationPractices and Initiatives
78
AGING ASSETS A PROBLEM FOR ASSET MANAGERS
- Aug 11, 2014
- TD World magazine conducted the expansive
research, collecting data from June 5-9, 2014,
and 685 - respondents representing TD managers and
engineers working in construction, maintenance, - operations and engineering. A majority of TD
professionals reported that their companies are
addressing aging assets (65), followed by the
use of smart meters feeding outage management
systems (42), according to a new survey
sponsored by Burns McDonnell.
(http//tdworld.com/sitefiles/tdworld.com/files/up
loads/2014/08/BurnsMcDonnellSurvey.pdf) - TD World magazine conducted the expansive
research, collecting data from June 5-9, 2014,
and 685 respondents representing TD managers and
engineers working in construction, maintenance,
operations and engineering. The report looks at
all the of the main issues professionals are
facing including aging assets, equipment and
technology investments, upgrading capacity vs.
lessening susceptibility, power delivery system
redesign plans. Some interesting statistics - The majority are investing in diagnostic
equipment (66), while 52 are installing outage
management systems. Far fewer are looking at
self-healing circuits (21). - A third of respondents (34) report their
utilities are planning to redesign their power
delivery systems within the next two years to
accommodated distributed generation, including
16 who plan to do so within the next year. - Respondent attitudes are divided with regard to
whether or not it would make sense for their
utilities to support the development of hybrid
microgrids in order to take congestion off the
utility grid while meeting local interests in
being more independent 28 believe this would
make sense for their utilities, 35 believe it
may, and 37 are doubtful. - Just under a third of respondents (29) expressed
a healthy interest in learning more about
compliance with FERC Order 1000, which enables
companies to compete against incumbent utilities
and bid to deliver turnkey transmission to meet
ISO requested transmission. Another 31 are
moderately interested.
79
Potential for Terrorist Attack
The U.S. could suffer a coast-to-coast blackout
if saboteurs knocked out just nine of the
country's 55,000 electric-transmission
substations on a scorching summer day, according
to a previously unreported federal analysis.
Gunmen attacked transformers at PGE's Metcalf
substation near San Jose, Calif., last year,
putting it out of service for almost a month.
Talia Herman for The Wall Street Journal
80
A Process Model for Managing the Network
Respond to Emergencies
Add New Customers
Sustain Network
Expand Network
Operate Network
Project/Portfolio Management
Develop and Approve Asset Plans
Develop Network Strategy
81
Substation Practices/initiatives section
- 2013 Sections
- Asset Management RCM and Life cycle costing
approaches replacement programs, and problematic
equipment - Planning/Engineering/Design Changes to standards
- Substation Automation Technology and
initiatives underway - Job Estimating Software tools and role of
construction - Mobiles/Spares Deployment of mobiles and spare,
and optimization techniques - Field Maintenance Activities Initiatives
underway, degree of crew specialization, and
work management systems - NERC Maintenance Standards Impact of NERC
standards on substation maintenance - Maintenance Inspections, impact of deferred
maintenance, initiatives to reduce outages
- 2014 Proposed by Process
- Asset Management
- Strategy
- Substation automation
- Mobile spares
- Sustain Substations
- Maintenance planning
- Field maintenance
- Including NERC standards
- Replacement/upgrades
- Expand Substations
- Planning/Engineering/Design
- Job estimating
- Field Construction
82
Substation practice Questions
- 2014 Proposed by Process
- Asset Management
- Strategy
- Substation automation
- Mobile spares
- Sustain Substations
- Maintenance planning
- Field maintenance
- Including NERC standards
- Replacement/upgrades
- Expand Substations
- Planning/Engineering/ Design
- Job estimating
- Field Construction
- Asset Management (AM)
- Role of the Asset Management organization in
decision -making - Key responsibilities of the Substation AM
organization - What keeps you up at night worrying about your
system - Analytic approaches used to predict replacement
needs - Use of concepts embodied in RCM in Subs
- Use of the concepts embodied in 'Life Cycle
Costing' - Use predictive reliability analysis tools on
component failure rates - Replacement Programs Underway Power
Transformers Switch Gear Circuit Breakers
Relays Instrument Transformers
Secondary/Communications - Classes of equipment that are becoming
problematic - Other Classes of equipment that are becoming
problematic - Use of dedicated software tools to support
substation AM
83
1QC Industry PerspectiveSubstations
84
Key Success FactorsManage assets
85
2014 TD Substations Substation WHAT KEEPS YOU
UP AT NIGHT WORRYING ABOUT YOUR SYSTEM
ID Response
31 Knowledge Transfer and the development of field personnel continues to be a major problem as the tenured work force leaves.
28 Safety, theft, our ability to manage the reliability of all the software/firmware/settings associated with microprocessor control equipment.
33 Trans bank failures, relay misoperations
37 Aging infrastructure coupled with limited resources to address
38 Maintaining a good maintenance program AND meeting OM targets.
40 Older equipment (Reliability) and lack of spare parts or vendor support. Electromechanical relays.
24 The increasing age, deteriorating condition, and decreasing reliability of several classes of equipment in the system - despite continuing efforts at cost effective Condition Based Maintenance (CBM).
21 Aging equipment
30 Substations without internal T- line protection, aging infrastructure, incomplete and inaccurate asset history and maintenance data
27 Aging equipment, EHV transformer failure, large customers with single source transformer
359 Aging assets and unexpected failures.
32 Loss of AY autobank or RR autobank 1 until new RR autobank 2 is in service
Calculation used SP10.1
86
2014 TD Substations ANALYTIC APPROACHES USED TO
PREDICT REPLACEMENT NEEDS
ID Response
22 Condition health assesment in Cascade
31 Condition/operational monitoring, equipment history, environment issues
28 MTBF (mean time between failures) is a key metric . Our Sustain Investment Model looks at groups of assets, anticipated lifetimes, historical performance to determine an evergreen investment program over multiple decades.
33 Using cascade we've identified replacement criteria by asset category. We use manufacture recommendations and industry standards
23 Failure history, performance, maintenance requirements and grid criticality.
37 Past failure trending, industry benchmarking and trending, trending of test data
38 Proprietary models by equipment class to determine replacement order.
40 Costs, trips per line, age of equipment, availability of spare parts and support. Infrared, test results.
21 Data from worst performing circuits, track failure rates by equipment types and cause. We are developing a risk based maintenance strategy to drive replacement needs that will take into consideration probability of failure (health), consequence of failure (criticality) and life cycle costing considerations.
30 Transformer criticality spreadsheet that factors in customer base, average loading, emergency ties, and transformer DGA test results. We take historical hazard/survival rates for each particular asset classification into consideration when determining overall operational risk to the organization
27 Power factor testing, DGA, and trends of like equipment.
359 For long range planning, look at population models and how the age is varying with time. For individual components, use health index and criticality of the asset.
32 Mean time between failures, life expectancy, fleet analysis, previous inspection findings (eg wood pole test/treat reject rates). TRANS - 1) DGA 2) Doble test, megger test, etc. 4) Difficulty in buying replacement parts 5) Maintenance history
Calculation used SP15.1
87
2014 TD Substations ANALYTIC APPROACHES USED TO
PREDICT REPLACEMENT NEEDS
PSEG
24 Our Computerized Maintenance Management System (CMMS) provides the means for optimizing the maintenance of our assets through the use of condition - based tools. It is a decision support system that assists in making repair/replace/maintain decisions. The CBM implementation strategy through CMMS requires the comprehensive integration of data from multiple systems. These systems include but are not limited to OMSto gather weekly inspection data, delivery work management (DWMS) to gather diagnostic data collection from field personnel, system and equipment operational data, equipment test data, and on - line equipment monitoring data. This system utilizes available information on equipment health by incorporating it into the maintenance decision process. Algorithms have been set up to provide ranking systems for all major equipment. The algorithm factors are based on the data available for each particular asset, and the factor weightings vary between voltage classes. The Action Algorithms provide a score for each asset, with those most in need of review and/or action scoring the highest. Replacement Algorithms are used to help identify equipment advancing towards completion of useful life. The algorithms are periodically reviewed and adjusted to keep them on track in identifying equipment maintenance needs.
88
2014 TD Substations USE OF CONCEPTS EMBODIED IN
'RELIABILITY CENTERED MAINTENANCE' IN SUBSTATIONS
ID Response
22 Maintenance tempaltes use failure modes to determine appropriate PM taslks
31 Set frequencies of maintenance, required test performed
28 We use function, criticality, and condition monitoring to establish our maintenance programs.
33 we look at equip category failure history by manufacture, age, duty cycle to help predict future replacement criteria.
23 Targeting worse performers, reviewing failure modes and customer impacts and the risk to grid on run to failure scenarios.
37 Gone to condition base versus time based maintenance on some assets. Adjusted maintenance intervals and tasks based on performance. Prioritized spending on maintenance
38 Monitor critical parameters and replace the worst first. Use equipment condition wherever possible.
40 Specific reads on inspection triggers
21 Used to determine the proper maintenance strategy for assets. In addition, used to drive some equipment upgrades and/or reliability improvement projects. We are not heavily involved in RCM currently.
27 Criticality, impact, failure modes, cost of assets used to determine maintenance cycles
359 For replacement strategy, look at multiple inputs to make decisions, not just one, such as age
89
USE OF CONCEPTS EMBODIED IN 'RELIABILITY CENTERED
MAINTENANCE' IN SUBSTATIONS
PSEG
24 Reliability Centered Maintenance (RCM), or Condition - Based Maintenance (CBM), is a proactive equipment maintenance capability that uses system health indications to identify and predict functional failure in advance of the event and provide the ability to take appropriate preventive action. This approach to maintenance uses data drawn during operations and/or maintenance intervals to forecast the need for additional or future maintenance. It extends the concepts of predictive maintenance by using data from maintenance tests. Ideally condition - based maintenance will allow maintenance personnel to locate and resolve asset functionality issues before they escalate, minimizing corrective maintenance costs and system downtime.
32 TRANS - All major eqipment is routinely maintained on a time based system. Maintenance intervals are based on a combination of generally accepted industry practice, performance history, age of equipment, and to some degree the criticality of the equipment. Nonroutine maintenance is performed as required.
90
2014 TD Substations USE PREDICTIVE RELIABILITY
ANALYSIS
Calculation used SP30.1
ID Response
31 TORT - Transmission operational data
28 Yes, Asset Health Index (AHI) and Strategic Asset Management (SAM) tools part of the EPS - M UtiliCase.
33 no
23 We track SAIDI, SAIFI, CAIDI as they relate to transmission line,station and feeder performance. We analyze each incident that we encounter and search for the problem as a part of our equipment failure reporting in an attempt to identify and share failure modes and equipment issues that need to be addressed on other infrastructure of the same type.
38 Key metrics are used to verify effectiveness of improvement projects.
40 We use SAIFI and SAIDI that helps us to predict and determine reliability issues on our transmission lines and helps to determine replacement priorities.
24 Component failure rate information (as available) is used to recommend budgetary needs for equipment replacements required to maintain system reliability. Specific candidates for equipment replacement are determed by condition assessment review. Substation design philosophy includes redundancy and reliability considerations to minimize impact of Substation equipment failures on customer reliability metrics such as SAIFI and CAIDI.
21 Not sure what you are looking for with this question.
91
2014 TD Substations Substation REPLACEMENT
PROGRAMS UNDERWAY SUBSTATIONS
MOVE UP
Comments
Total Respondents 15
Power Transformers 86.67
Switch Gear 66.67
Circuit Breakers 93.33
Relays 80
Instrument Transformers 60
SecondaryCommunications 60
Other 40
Calculation used SP35.1 , SP35.2 , SP35.3 ,
SP35.4 , SP35.5 , SP35.6 , SP35.7 Legends
Power Transformers
?
?
?
?
?
?
?
?
?
?
?
?
?
Switch Gear
?
?
?
?
?
?
?
?
?
?
Circuit Breakers
?
?
?
?
?
?
?
?
Recommended
CrystalGraphics Presentations


