
Graphing Motion - PowerPoint PPT Presentation
1 / 3
Title:
Graphing Motion
Description:
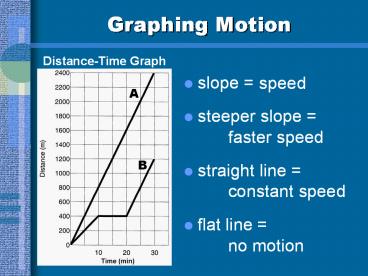
Graphing Motion Distance-Time Graph slope = steeper slope = straight line = flat line = speed A faster speed B constant speed no motion Graphing Motion Who started ... – PowerPoint PPT presentation
Number of Views:95
Avg rating:3.0/5.0
Title: Graphing Motion
1
Graphing Motion
- slope
- steeper slope
- straight line
- flat line
speed
faster speed
constant speed
no motion
2
Graphing Motion
- Who started out faster?
- A (steeper slope)
- Who had a constant speed?
- A (straight line)
- Describe B from 10-20 min.
- No motion stopped moving
- Find their average speeds.
- A (2400m) (30min) A 80 m/min
- B (1200m) (30min) B 40 m/min
3
Graphing Motion
The graph to the left shows an ants motion while
traveling along a piece of food. The ant is
moving east-west and its starting position is at
time0.
East
- Specify the time period when the ant was...
- Slowing down
- 5 to 10 seconds
- Speeding up
- 0 to 3 seconds
- Moving at a constant speed
- 5 to 10 seconds
- Not moving
- 3 to 5 seconds
- Back at the original starting position
- 10 seconds
Distance (cm)
West
Recommended
CrystalGraphics Presentations


