
The Barcode Gap - PowerPoint PPT Presentation
1 / 37
Title:
The Barcode Gap
Description:
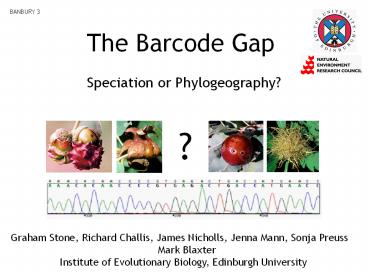
BANBURY 3 The Barcode Gap Speciation or Phylogeography?? Graham Stone, Richard Challis, James Nicholls, Jenna Mann, Sonja Preuss Mark Blaxter Institute of ... – PowerPoint PPT presentation
Number of Views:121
Avg rating:3.0/5.0
Title: The Barcode Gap
1
The Barcode Gap
BANBURY 3
- Speciation or Phylogeography?
?
Graham Stone, Richard Challis, James Nicholls,
Jenna Mann, Sonja Preuss Mark Blaxter
Institute of Evolutionary Biology,
Edinburgh University
2
BANBURY 3
Phylogeography and DNA barcoding often use the
same tools, but have different aims.
- Barcoding
- aims to identify species-specific sequences at a
single locus. - would like to capture the full diversity of
sequence variation inherent in a taxon, but
usually does not. - works best when ancestral polymorphism between
sister lineages has been completely sorted,
creating monophyletic sister clades and a
barcoding gap.
3
BANBURY 3
- Mitochondrial barcoding traumas
- Incomplete sorting of ancestral polymorphism.
- Barcodes jump between species.
- Introgression and sorting may only become
obvious if you sample closely related taxa in
depth. You cannot know the scale of this problem
by sampling one taxon. - Empiricially, barcoding generally works.
4
BANBURY 3
- Phylogeography
- Reconstructs the spatial relationships between
lineages over time - Requires extensive within-species sampling
- Commonly combines mitochondrial and nuclear
markers (allozymes, microsatellites, sequence) - Struggles to find nuclear loci polymorphic enough
to allow direct comparison with mitochondrial
sequence data.
5
BANBURY 3
Phylogeographic analyses of closely related
species can, coincidentally, allow stringent
testing of the of the DNA barcoding approach.
6
BANBURY 3
Oak gallwasps
- 1000 species worldwide, highly hostplant
specific - induce characteristic gall structures
- Nuclear gallwasp genes determine gall structure
distinctive gall morphologies reliably identify
species.
7
They support ecologically closed communities of
natural enemies
BANBURY 3
8
Individual species are found across the Western
Palaearctic
BANBURY 3
9
..with populations in multiple glacial refugia
Turkish refugia
Iranian refugia
BANBURY 3
10
Comparative phylogeography
Concordance same origin, direction and timescale
Concordance same origin and direction, different
timescales/demographies
Discordance different origin and different
direction ( same timescale)
BANBURY 3
11
Gallwasp phylogeography
Andricus kollari
Allozyme allele frequency data 13 loci, 2100
individuals 70 sites
Intraspecific variation in widespread species
corresponds to refugia
BANBURY 3
12
Gallwasp phylogeography
Andricus kollari
433 bp Cytb, 160 individuals
2-3MY
BANBURY 3
13
Introgression and backcrossing creates barcode
mismatches
Andricus kollari
433 bp Cytb, 160 individuals
2-3MY
BANBURY 3
14
Parasitoid phylogeography
BANBURY 3
Eastern haplotypes
1.8 MY
European haplotypes
15
The Andricus quercuscalicis clade
BANBURY 3
..is a group of closely-related oak gallwasp
species with highly diagnostic gall phenotypes
Andricus quercuscalicis
Andricus quercustozae
Andricus dentimitratus
Andricus caputmedusae
16
Cytochrome b sequence resolves each species into
glacial refuge clades
Outgroup individuals from Turkey
Andricus quercustozae
433 bp Cytochrome b (all seqs ORF)
K2P NJ
BANBURY 3
17
But the geographic origin of outgroups influences
relationships between these clades
Outgroup individuals from Turkey
Outgroup individuals from C. Europe
BANBURY 3
18
Analyse data for all 4 closely-related species
(n600 individuals, 221 haplotypes)
K2P NJ
BANBURY 3
19
Analyse data for all 4 closely-related species
(n600 individuals, 221 haplotypes) Sequence
divergence within this whole group matches that
within single gallwasp species (e.g. A. kollari)
K2P NJ
BANBURY 3
20
Molecular Operational Taxonomic Units (MOTU)s
identified using MOTU_define
BANBURY 3
21
Identify MOTUs using MOTU_define Little sign of
a genuine barcoding gap in these data
Colour blocks show 8bp MOTUs
BANBURY 3
22
MOTUs rarely correspond to species
Andricus quercustozae
Colour blocks show 8bp MOTUs
Colour blocks show 8bp MOTUs
BANBURY 3
23
MOTUs rarely correspond to species
Andricus caputmedusae
Colour blocks show 8bp MOTUs
Colour blocks show 8bp MOTUs
BANBURY 3
24
MOTUs rarely correspond to species
Andricus dentimitratus
Colour blocks show 8bp MOTUs
Colour blocks show 8bp MOTUs
BANBURY 3
25
MOTUs rarely correspond to species
Andricus quercuscalicis
Colour blocks show 8bp MOTUs
Colour blocks show 8bp MOTUs
BANBURY 3
26
This is true irrespective of the threshold
sequence difference for MOTUs
Colour blocks show 8bp MOTUs
Colour blocks show 8bp MOTUs
BANBURY 3
27
This is true irrespective of the threshold
sequence difference for MOTUs
Colour blocks show 8bp MOTUs
Colour blocks show 8bp MOTUs
BANBURY 3
28
.. And is true when phylogeny reconstruction uses
more complex models MrBAYES HKYG, partitioned
by codon position, parameter estimates unlinked
across partitions Ln Bayes Factors against
species monophyly Andricus caputmedusae
270 Andricus dentimitratus 332 Andricus
quercustozae 158
BANBURY 3
29
Instead, multispecies MOTUs correspond to
geographic regions
BANBURY 3
30
What generates the observed pattern?
Geographic grouping rules out sorting of
ancestral polymorphism No evidence for role of
symbionts Wolbachia, Cardinium, Spiroplasma,
Flavobacteria.
BANBURY 3
31
What generates the observed pattern?
Nuclear sequence data do not support multispecies
clades sorted by refuge
702 bp Nuclear Long wavelength opsin gene
BANBURY 3
32
What generates the observed pattern?
Nuclear sequence data do not support multispecies
clades sorted by refuge MtDNA data
0.99
0.95
702 bp Nuclear Long wavelength opsin gene
BANBURY 3
33
What generates the observed pattern?
Nuclear sequence data do not support multispecies
clades sorted by refuge MtDNA data Observed
mtDNA patterns are compatible with hybridisation
and back-crossing to parental types within
refugia
0.99
0.95
702 bp Nuclear Long wavelength opsin gene
BANBURY 3
34
Conclusions 1
- How common is this pattern?
- Dont know we need studies of appropriate taxa.
But gallwasps are unlikely to be an isolated
case. - Many radiations of species have occurred over the
same timescale, especially insects. - Most widespread taxa show differentiation between
regional refugia. - Little is known for most taxa about current or
past hybridisation within refugia. - Expect to find more examples as phylogenetic
density of barcode sampling increases. - Not safe to assume it is rare.
BANBURY 3
35
Conclusions 2
A worst case scenario IF related taxa often
hybridise in refugia, mtDNA barcoding will
generate a molecular taxonomy of refugia, not
species. Barcoding gaps would then indicate
phylogeographic breaks, not speciation. Cool
for reconstructing community history, bad for
species barcodes.
BANBURY 3
36
Conclusions 3
1. We should check how often this occurs, even in
groups where we think barcoding works, by
sampling over the full range of species. 2. We
need nuclear sequence markers to corroborate
mitochondrial barcodes.
BANBURY 3
37
Look on the bright side
- What could CBOL do with broader mtnuclear
sampling that it cant do now? - Reduce uncertainty in identification
- Facilitate array-based barcoding
- Identify sources and demographies of key target
species. - Assess multispecies concordance biodiversity
hotspots. - Enhance phylogenetic utility
BANBURY 3
Recommended
CrystalGraphics Presentations


