
X RAY DIFFRACTION- XRD - PowerPoint PPT Presentation
1 / 55
Title:
X RAY DIFFRACTION- XRD
Description:
X RAY DIFFRACTION- XRD SOLID MATTER-AMORPHOUS: Atoms arranged in a random manner , like in liquids- eg: Glass CRYSTALLINE: Atoms arranged in a regular pattern. – PowerPoint PPT presentation
Number of Views:812
Avg rating:3.0/5.0
Title: X RAY DIFFRACTION- XRD
1
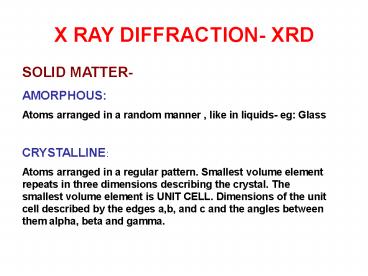
X RAY DIFFRACTION- XRD
SOLID MATTER- AMORPHOUS Atoms arranged in a
random manner , like in liquids- eg
Glass CRYSTALLINE Atoms arranged in a regular
pattern. Smallest volume element repeats in three
dimensions describing the crystal. The smallest
volume element is UNIT CELL. Dimensions of the
unit cell described by the edges a,b, and c and
the angles between them alpha, beta and gamma.
2
X - RAYS
- German scientist Rontgen discovered X-rays in
1895 accidentally when working with discharge
tube. - Barium platinocyanide screen placed near the tube
began to glow, Glow continued even when a wooden
screen was placed between them. - As cause was not known, called as X-rays.
- It could pass through opaque bodies. Wave length
shorter than that of ultraviolet light.
3
(No Transcript)
4
- Essential elements of a coolidge X- ray vacuum
tube - Cathode- tungsten filament heated to
incandescence by a low voltage AC from a step
down transformer/ storage battery. - Emits large number of electrons known as
thermions focused on a target using cylindrical
shields (molybdenum) - Shield maintained at a negative potential
surrounding the cathode. - Electrons accelerated to very high speeds by DC
potential difference about 50kV to 100kV applied
between cathode and anode (anticathode). The high
DC from a step up transformer.
Electrons
Tungsten filament
Cooling water
Shield
X rays
5
(No Transcript)
6
- The Coolidge tube (1913) is also called hot
cathode tube - It works with a very good quality vacuum (about
10-4 Pa, or 10-6 Torr). - The filament is the cathode of the tube. The high
voltage potential is between the cathode and the
anode, the electrons are accelerated and then hit
the anode. - There are two designs end-window tubes and
side-window tubes. - In the end-window tubes, the filament is around
the anode, the electrons have a curved path. - Special about side-window tubes is
- An Electrostatic lens focuses the beam onto a
very small spot on the anode - The anode is specially designed to dissipate the
heat and wear resulting from this intense focused
barrage of electrons - Mechanically spun to increase the area heated by
the beam. - Cooled by circulating coolant.
- The anode is precisely angled at 1-20 degrees off
perpendicular to the electron current so as to
allow escape of some of the X-ray photons which
are emitted essentially perpendicular to the
direction of the electron current. - The anode is usually made out of tungsten or
molybdenum. - The tube has a window designed for escape of the
generated X-ray photons. - The power of a Coolidge tube usually ranges from
1 to 4 kW
7
Introduction to X-ray Diffraction
- References
- Elements of Modern X-ray Physics, Jens
Als-Nielsen and Des McMorrow, John Wiley Sons,
Ltd., 2001 - (Modern x-ray physics new developments)
- X-ray Diffraction, by B.E. Warren, General
Publishing Company, 1969, 1990 - (Classic x-ray physics book)
- Elements of X-ray Diffraction,2nd Ed., by B.D.
Cullity, Addison-Wesley, 1978 - (Covers most techniques used in traditional
material characterization) - High Resolution X-ray Diffractometry and
Topography, by D. Keith Bowen and Brian K.
Tanner, Taylor Francis, Ltd., 1998 - (Semiconductors and thin film analysis)
- Modern Aspects of Small-Angle Scattering, by H.
Brumberger, Editor, Kluwer Academic Publishers,
1993 - (SAXS techniques)
- Principles of Protein X-ray Crystallography, by
Jan Drenth, Springer, 1994 - (Crystallography)
8
(No Transcript)
9
- The incoming beam (coming from upper left) causes
each scatterer to re-radiate a small portion of
its energy as a spherical wave. - If scatterers are arranged symmetrically with a
separation d, these spherical waves will be in
synch only in directions where their path-length
difference 2 d sin ? equals an integer multiple
of the wavelength ?. - In that case, part of the incoming beam is
deflected by an angle 2?, producing a reflection
spot in the diffraction pattern
10
An intuitive understanding of XRD can be obtained
from the Bragg Model of Diffraction.
- In this model, a given reflection is associated
with a set of evenly spaced sheets running
through the crystal, usually passing through the
centers of the atoms of the crystal lattice. - The orientation of a particular set of sheets is
identified by its three MILLER INDICES (h, k, l),
and let their spacing be noted by d. - WILLIAM LAWARENCE BRAGG proposed a model in which
the incoming X-rays are scattered specularly
(mirror-like) from each plane from that
assumption, X-rays scattered from adjacent planes
will combine constructively when the angle ?
between the plane and the X-ray results in a
path-length difference that is an integer
multiple n of the X-ray wave length ?.
11
- A reflection is said to be indexed when its
Miller indices have been identified from the
known wavelength and the scattering angle 2?.
Such indexing gives the unit cell parameters, the
lengths and angles of the unit-cell, as well as
its space group. Since BRAGGS LAW does not
interpret the relative intensities of the
reflections, however, it is generally inadequate
to solve for the arrangement of atoms within the
unit-cell for that, a Fourier transform method
must be carried out.
12
BRAGGS LAW
13
Theoretical Considerations
14
An X-ray diffraction pattern formed when X-rays
are focused on a crystalline material, (a
protein). Each dot, called a reflection, forms
from the coherent interference of scattered
X-rays passing through the crystal. X-ray
scattering techniques are a family of
non-destructive analytical techniques which
reveal information about the crystallographic
structure, chemical composition, and physical
properties of materials and thin films. These
techniques are based on observing the scattered
intensity of an X-RAY beam hitting a sample as a
function of incident and scattered angle,
polarization, and wavelength or energy.
15
X-ray diffraction techniques
- X-ray diffraction finds the geometry or shape of
a molecule using x-rays. X-ray diffraction
techniques are based on the elastic scattering of
x-rays from structures that have long range
order. - Single-crystal X-ray diffraction is a technique
used to solve the complete structure of
crystalline materials, ranging from simple
inorganic solids to complex macromolecules, such
as proteins. - Powder diffraction (XRD) is a technique used to
characterize the crystallographic structure,
crystallite size (grain size), and preferred
orientation in polycrystalline or powdered solid
samples. Powder diffraction is commonly used to
identify unknown substances, by comparing
diffraction data against a database maintained by
the International Centre for Diffraction Data. It
may also be used to characterize heterogeneous
solid mixtures to determine relative abundance of
crystalline compounds and, when coupled with
lattice refinement techniques, such as Rietveld
refinement, can provide structural information on
unknown materials. Powder diffraction is also a
common method for determining strains in
crystalline materials.
16
- Thin film diffraction and grazing incidence x-ray
diffraction may be used to characterize the
crystallographic structure and preferred
orientation of substrate-anchored thin films. - High-resolution x-ray diffraction is used to
characterize thickness, crystallographic
structure, and strain in thin epitaxial films. It
employs parallel-beam optics. - X-ray pole figure analysis enables one to analyze
and determine the distribution of crystalline
orientations within a crystalline thin-film
sample. - X-ray rocking curve analysis is used to quantify
grain
17
Scattering techniques
- Elastic scattering
- Materials that do not have long range order may
also be studied by scattering methods that rely
on elastic scattering of monochromatic x-rays. - Small angle X-ray scattering (SAXS) probes
structure in the nanometer to micrometer range by
measuring scattering intensity at scattering
angles 2? close to 0. - X-ray reflectivity is an analytical technique for
determining thickness, roughness, and density of
single layer and multilayer thin films. - Wide angle X-ray scattering (WAXS), a technique
concentrating on scattering angles 2? larger than
5. - Inelastic scattering
- When the energy and angle of the inelastically
scattered x-rays are monitored scattering
techniques can be used to probe the electronic
band structure of materials. - Compton scattering
- Resonant inelastic x-ray scattering (RIXS)
- X-ray Raman scattering
18
- X-ray Generation Properties
- Lattice Planes and Bragg's Law
- Powder Diffraction
- Thin Film Diffraction
- Texture Measurement (Pole Figures)
- Residual Stress Measurements
- Small Angle X-ray Scattering (SAXS)
- X-ray Crystallography
19
1. X-ray Generation Properties
- X-rays are electromagnetic radiation with typical
photon energies in the range of 100 eV - 100 keV.
For diffraction applications, only short
wavelength x-rays (hard x-rays) in the range of a
few angstroms to 0.1 angstrom (1 keV - 120 keV)
are used. - Because the wavelength of x-rays is comparable to
the size of atoms, they are ideally suited for
probing the structural arrangement of atoms and
molecules in a wide range of materials. The
energetic x-rays can penetrate deep into the
materials and provide information about the bulk
structure. - X-rays are produced generally by either x-ray
tubes or synchrotron radiation. In a x-ray tube,
which is the primary x-ray source used in
laboratory x-ray instruments, x-rays are
generated when a focused electron beam
accelerated across a high voltage field bombards
a stationary or rotating solid target. As
electrons collide with atoms in the target and
slow down, a continuous spectrum of x-rays are
emitted, which are termed Bremsstrahlung
radiation. The high energy electrons also eject
inner shell electrons in atoms through the
ionization process. When a free electron fills
the shell, a x-ray photon with energy
characteristic of the target material is emitted.
20
- Common targets used in x-ray tubes include Cu and
Mo, which emit 8 keV and 14 keV x-rays with
corresponding wavelengths of 1.54 Å and 0.8 Å,
respectively. (The energy E of a x-ray photon and
it's wavelength is related by the equation E
hc/l, where h is Planck's constant and c the
speed of light) - In recent years synchrotron facilities have
become widely used as preferred sources for x-ray
diffraction measurements. Synchrotron radiation
is emitted by electrons or positrons travelling
at near light speed in a circular storage ring.
These powerful sources, which are thousands to
millions of times more intense than laboratory
x-ray tubes, have become indispensable tools for
a wide range of structural investigations and
brought advances in numerous fields of science
and technology.
21
2. Lattice Planes and Bragg's Law
- X-rays primarily interact with electrons in
atoms. When x-ray photons collide with electrons,
some photons from the incident beam will be
deflected away from the direction where they
original travel, much like billiard balls
bouncing off one anther. If the wavelength of
these scattered x-rays did not change (meaning
that x-ray photons did not lose any energy), the
process is called elastic scattering (Thompson
Scattering) in that only momentum has been
transferred in the scattering process. These are
the x-rays that we measure in diffraction
experiments, as the scattered x-rays carry
information about the electron distribution in
materials. On the other hand, In the inelastic
scattering process (Compton Scattering), x-rays
transfer some of their energy to the electrons
and the scattered x-rays will have different
wavelength than the incident x-rays.
22
- Diffracted waves from different atoms can
interfere with each other and the resultant
intensity distribution is strongly modulated by
this interaction. If the atoms are arranged in a
periodic fashion, as in crystals, the diffracted
waves will consist of sharp interference maxima
(peaks) with the same symmetry as in the
distribution of atoms. Measuring the diffraction
pattern therefore allows us to deduce the
distribution of atoms in a material.
23
- The peaks in a x-ray diffraction pattern are
directly related to the atomic distances.
Consider an incident x-ray beam interacting with
the atoms arranged in a periodic manner as shown
in 2 dimensions - The atoms, represented as green spheres in the
graph, can be viewed as forming different sets of
planes in the crystal (colored lines). For a
given set of lattice plane with an inter-plane
distance of d, the condition for a diffraction
(peak) to occur can be written as - known as the Bragg's law, after
W.L. Bragg, who first proposed it. - n is an integer representing the order of
the diffraction peak. The Bragg's Law is one of
most important laws used for interpreting x-ray
diffraction data. - Here, atoms are used as scattering points in this
example, Bragg's Law applies to scattering
centers consisting of any periodic distribution
of electron density. Ie., the law holds true if
the atoms are replaced by molecules or
collections of molecules, such as colloids,
polymers, proteins and virus particles
24
3. Powder Diffraction
- Powder XRD (X-ray Diffraction) is perhaps the
most widely used x-ray diffraction technique for
characterizing materials. As the name suggests,
the sample is usually in a powdery form,
consisting of fine grains of single crystalline
material to be studied. The technique is used
also widely for studying particles in liquid
suspensions or polycrystalline solids (bulk or
thin film materials).
25
- The term 'powder' really means that the
crytalline domains are randomly oriented in the
sample. Therefore when the 2-D diffraction
pattern is recorded, it shows concentric rings of
scattering peaks corresponding to the various d
spacings in the crystal lattice. The positions
and the intensities of the peaks are used for
identifying the underlying structure (or phase)
of the material. For example, the diffraction
lines of graphite would be different from diamond
even though they both are made of carbon atoms.
This phase identification is important because
the material properties are highly dependent on
structure (just think of graphite and diamond). - .
26
Powder diffraction data can be collected using
either transmission or reflection geometry, as
shown below. Because the particles in the
powder sample are randomly oriented, these two
methods will yield the same data. In the MRL
x-ray facility, powder diffraction data are
measured using the Philips XPERT MPD
diffractometer, which measures data in reflection
mode and is used mostly with solid samples, or
the custom built 4-circle diffractometer, which
operates in transmission mode and is more
suitable for liquid phase samples
27
MOUNTING THE CRYSTAL
DIFFRACTOMETER
28
A powder XRD scan from a K2Ta2O6 sample is as
shown -as a plot of scattering intensity v/s. the
scattering angle 2theta or the corresponding
d-spacing. The peak positions, intensities,
widths and shapes all provide important
information about the structure of the material.
29
4. Thin Film Diffraction
- Thin film diffraction refers not to a specific
technique but rather a collection of XRD
techniques used to characterize thin film samples
grown on substrates. These materials have
important technological applications in
microelectronic and optoelectronic devices, where
high quality epitaxial films are critical for
device performance. Thin film diffraction methods
are used as important process development and
control tools, as hard x-rays can penetrate
through the epitaxial layers and measure the
properties of both the film and the substrate. - There are several special considerations for
using XRD to characterize thin film samples. (i)
reflection geometry is used for these
measurements as the substrates are generally too
thick for transmission. (ii) high angular
resolution is required because the peaks from
semiconductor materials are sharp due to very low
defect densities in the material. Multiple bounce
crystal monochromators are used to provide a
highly collimated x-ray beam for these
measurements. - Eg in the Philips MRD used in the x-ray
facility, a 4-crystal monochromator made from Ge
is used to produce an incident beam with less
than 5 arc seconds of angular divergence.
30
- Basic XRD measurements made on thin film samples
include - Precise lattice constants measurements derived
from 2q - q scans, which provide information
about lattice mismatch between the film and the
substrate and therefore is indicative of strain
stress - Rocking curve measurements made by doing a q scan
at a fixed 2q angle, the width of which is
inversely proportionally to the dislocation
density in the film and is therefore used as a
gauge of the quality of the film. - Superlattice measurements in multilayered
heteroepitaxial structures, which manifest as
satellite peaks surrounding the main diffraction
peak from the film. Film thickness and quality
can be deduced from the data. - Glancing incidence x-ray reflectivity
measurements, which can determine the thickness,
roughness, and density of the film. This
technique does not require crystalline film and
works even with amorphous materials. - Texture measurements-(discussed separately)
31
- The graph shows the high resolution XRD data of
the superlattice peaks on the GaN (002)
reflections. - Red line denotes results of computer simulation
of the structure.
32
5. Texture Measurement (Pole Figure)
- Texture measurements are used to determine the
orientation distribution of crystalline grains in
a polycrystalline sample. A material is termed
textured if the grains are aligned in a preferred
orientation along certain lattice planes. One can
view the textured state of a material (typically
in the form of thin films) as an intermediate
state in between a completely randomly oriented
polycrystalline powder and a completely oriented
single crystal. The texture is usually introduced
in the fabrication process (e.g. rolling of thin
sheet metal, deposition,etc.) and affect the
material properties by introducing structural
anisotropy.
33
- A texture measurement is also referred to as a
pole figure as it is often plotted in polar
coordinates consisting of the tilt and rotation
angles with respect to a given crytallographic
orientation. A pole figure is measured at a fixed
scattering angle (constant d spacing) and
consists of a series of f -scans (in- plane
rotation around the center of the sample) at
different tilt or Y -(azimuth) angles, as
illustrated below.
34
- The pole figure data are displayed as contour
plots or elevation graphs with zero angle in the
center. Below we show two pole figure plots using
the same data set. An orientation distribution
function (ODF) can be calculated using the pole
figure data.
35
6. Residual Stress Measurement
- Structural and residual stress in materials can
be determined from precision lattice constants
measurements. For polycrystalline samples high
resolution powder diffraction measurements
generally will provide adequate accuracy for
stress evaluation. For textured (oriented) and
single crystalline materials, 4-circle
diffractometry is needed in which the sample is
rotated so that measurements on multiple
diffraction peaks can be carried out. The
interpretation of stress measurement data is
complicated and model dependent. Consult the
reference literature for more details
36
7. Small Angle X-ray Scattering (SAXS)
- SAXS measurements typically are concerned with
scattering angles lt 1o. As dictated by Bragg's
Law, the diffraction information about structures
with large d-spacings lies in the region.
Therefore the SAXS technique is commonly used for
probing large length scale structures such as
high molecular weight polymers, biological
macromolecules (proteins, nucleic acids, etc.),
and self-assembled superstructures (e.g.
surfactant templated mesoporous materials). - SAXS measurements are technically challenging
because of the small angular separation of the
direct beam (which is very intense) and the
scattered beam. Large specimen-to-detector
distances (0.5 m - 10 m) and high quality
collimating optics are used to achieve good
signal-to-noise ratio in the SAXS measurement.
37
- The MRL x-ray facility has cutting edge
capabilities for SAXS measurements with three
custom-built SAXS instruments including one
3.5-meter long ultra-small angle SAXS instrument
with state-of-the-art optics and area detector
for low scattering density samples (see
instrumentation section for more details)
38
8. X-ray Crystallography
- X-ray crystallography is a standard technique for
solving crystal structures. Its basic theory was
developed soon after x-rays were first discovered
more than a century ago. However, over the years
it has gone through continual development in data
collection instrumentation and data reduction
methods. In recent years, the advent of
synchrotron radiation sources, area detector
based data collection instruments, and high speed
computers has dramatically enhanced the
efficiency of crystallographic structural
determination. Today x-ray crystallography is
widely used in materials and biological research.
Structures of very large biological machinery
(e.g. protein and DNA complexes, virus particles)
have been solved using this method.
39
- In x-ray crystallography, integrated intensities
of the diffraction peaks are used to reconstruct
the electron density map within the unit cell in
the crystal. To achieve high accuracy in the
reconstruction, which is done by Fourier
transforming the diffraction intensities with
appropriate phase assignment, a high degree of
completeness as well as redundancy in diffraction
data is necessary, meaning that all possible
reflections are measured multiple times to reduce
systematic and statistical error. The most
efficient way to do this is by using an area
detector which can collect diffraction data in a
large solid angle. The use of high intensity
x-ray sources, such as synchrotron radiation, is
an effective way to reduce data collection time.
40
- One of the central difficulties in structural
determination using x-ray crystallography is
referred to as the "phase problem", which arises
from the fact that the diffraction data contains
information only on the amplitude but not the
phase of the structure factor. Over the years
many methods have been developed to deduce the
phases for reflections, including computationally
based direct methods, isomorphous replacement,
and multi-wavelength anormalous diffraction (MAD)
methods.
41
X-ray crystallography
42
Procedure
- The technique of single-crystal X-ray
crystallography has three basic steps. The first
and often most difficult step is to obtain an
adequate crystal of the material under study. The
crystal should be sufficiently large (typically
larger than 100 micrometres in all dimensions),
pure in composition and regular in structure,
with no significant internal imperfections such
as cracks or twinning. A small or irregular
crystal will give fewer and less reliable data,
from which it may be impossible to determine the
atomic arrangement.
43
- In the second step, the crystal is placed in an
intense beam of X-rays, usually of a single
wavelength (monochromatic X-rays), producing the
regular pattern of reflections. As the crystal is
gradually rotated, previous reflections disappear
and new ones appear the intensity of every spot
is recorded at every orientation of the crystal.
Multiple data sets may have to be collected, with
each set covering slightly more than half a full
rotation of the crystal and typically containing
tens of thousands of reflection intensities.
44
- In the third step, these data are combined
computationally with complementary chemical
information to produce and refine a model of the
arrangement of atoms within the crystal. The
final, refined model of the atomic arrangement
now called a crystal structure is usually
stored in a public database.
45
- A real 3-dimensional crystal contains many sets
of planes. For diffraction, crystal must have the
correct orientation with respect to the incoming
beam. - Perfect, infinite crystal and perfectly
collimated beam diffraction condition must be
satisfied exactly.'' - Strains, defects, finite size effects,
instrumental resolution diffraction peaks are
broadened.
More formally, the scattered intensity is
proportional to the square of the Fourier
transform of the charge density
46
where is the charge density.
For perfect crystals, I(q) consists of delta
functions (perfectly sharp scattering). For
imperfect crystals, the peaks are broadened. For
liquids and glasses, it is a continuous, slowly
varying function
47
Features of Electron, X-ray, or Neutron
Diffraction
- For a known structure, pattern can be calculated
exactly. - Symmetry of the diffraction pattern given by
symmetry of the lattice. - Intensities of spots determined by basis of atoms
at each lattice point. - Sharpness and shape of spots determined by
perfection of crystal. - Liquids, glasses, and other disordered materials
produce broad fuzzy rings instead of sharp spots.
- Defects and disorder in crystals also result in
diffuse scattering.
48
The Ultimate'' (Technically Challenging)
Experiment
- Sample is tiny (micron-sized).
- The effect is weak (light elements, small
modulations, subtle modifications of the
long-range order). - Instrumental resolution (angle and energy) is
perfect'' allowing detailed measure- ments of
structural disorder. - Measurement is time-resolved (nanosecond time
scale). - To achieve all of the above, will need lots of
intensity in the primary beam together with
sensitive detection systems.
49
Powder vs. Single Crystal X-ray Diffraction
- SINGLE CRYSTAL
- Put a crystal in the beam, observe what
reflections come out at what angles for what
orientations of the crystal with what
intensities. - Advantages
- In principle you can learn everything there is to
know about the structure. - Disadvantages
- You may not have a single crystal. It is
time-consuming and difficult to orient the
crystal. If more than one phase is present, you
will not necessarily realize that there is more
than one set of reflections.
50
- POWDER
- Samples consists of a collection of many small
crystallites with random orientations. Average
over crystal orientations and measure the
scattered intensity as a function of outgoing
angle. - Disadvantage
- Inversion of the measured intensities to find the
structure is more difficult and less reliable. - Advantages
- It is usually much easier to prepare a powder
sample. You are guaranteed to see all
reflections. The best way to follow phase changes
as a function of temperature, pressure, or some
other variable.
51
Overview of single-crystal X-ray diffraction
- The oldest and most precise method of X-ray
crystallography is single-crystal X-ray
diffraction, in which a beam of X-rays are
reflected from evenly spaced planes of a single
crystal, producing a diffraction pattern of spots
called reflections.1 Each reflection
corresponds to one set of evenly spaced planes
within the crystal. The density of electrons
within the crystal is determined from the
position and brightness of the various
reflections observed as the crystal is gradually
rotated in the X-ray beam this density, together
with supplementary data, allows the atomic
positions to be inferred. For single crystals of
sufficient purity and regularity, X-ray
diffraction data can determine the mean chemical
bond lengths and angles to within a few
thousandths of an Ångström and to within a few
tenths of a degree, respectively. The data also
allow the static and dynamic disorder in the
atomic positions to be estimated, which is
usually less than a few tenths of an Ångström.
52
Limitations
- As the crystal's repeating unit, its unit cell,
becomes larger and more complex, the atomic-level
picture provided by X-ray crystallography becomes
less well-resolved (more "fuzzy") for a given
number of observed reflections. Two limiting
cases of X-ray crystallography are often
discerned, "small-molecule" and "macromolecular"
crystallography. Small-molecule crystallography
typically involves crystals with fewer than 100
atoms in their asymmetric unit such crystal
structures are usually so well resolved that its
atoms can be discerned as isolated "blobs" of
electron density. - By contrast, macromolecular crystallography often
involves tens of thousands of atoms in the unit
cell. Such crystal structures are generally less
well-resolved (more "smeared out") the atoms and
chemical bonds appear as tubes of electron
density, rather than as isolated atoms. In
general, small molecules are also easier to
crystallize than macromolecules however, X-ray
crystallography has proven possible even for
viruses with hundreds of thousands of atoms.
53
- The three-dimensional structure of penicillin,
for which Dorothy Crowfoot Hodgkin was awarded
the Nobel Prize in Chemistry in 1964. The green,
white, red and blue spheres represent atoms of
carbon, hydrogen, oxygen and nitrogen,
respectively.
54
The diffraction imaging layout at beamline 9.0.1
from left, coherent x-rays illuminate the sample
(center), which is mounted on a silicon nitride
window just 50 nanometers thick in a movable
frame
- Aerogels, sometimes called "frozen smoke, " can
be made from different materials. This silicon
aerogel is an efficient insulator.
55
Published on 31st July 2008
- A 500-nanometer cube of aerogel from the interior
of the 3-D volume, reconstructed by X-ray
diffraction. The foam structure shows globular
nodes that are interconnected by thin beam-like
struts.
Recommended
CrystalGraphics Presentations


