
History of Probability Theory - PowerPoint PPT Presentation
Title:
History of Probability Theory
Description:
History of Probability Theory Started in the year of 1654 De Mere (a well-known gambler) asked a question to Blaise Pascal (a mathematician) Whether to bet on the ... – PowerPoint PPT presentation
Number of Views:429
Avg rating:3.0/5.0
Title: History of Probability Theory
1
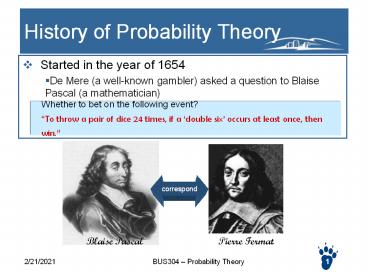
History of Probability Theory
- Started in the year of 1654
- De Mere (a well-known gambler) asked a question
to Blaise Pascal (a mathematician)
Whether to bet on the following event? To throw
a pair of dice 24 times, if a double six occurs
at least once, then win.
correspond
Blaise Pascal
Pierre Fermat
2
Applications of Probability Theory
- Gambling
- Poker games, lotteries, etc.
- Weather report
- Likelihood to rain today
- Power of Katrina
- Many more in modern business world
- Risk Management and Investment
- Value of stocks, options, corporate debt
- Insurance, credit assessment, loan default
- Industrial application
- Estimation of the life of a bulb, the shipping
date, the daily production
3
Concept Experiment and event
- Experiment A process that
- produces a single outcome
- whose result cannot be
- predicted with certainty.
- Event A certain outcome obtained in an
experiment.
- Example of an event (description of outcome)
- Two heads in a row when you flip a coin three
times - At least one double six when you throw a pair
of dice 24 times.
4
Description of Events
- Elementary Events
- The most rudimentary outcomes resulting from a
simple experiment - Throwing one die, obtaining a is an
elementary event - Denoted as e1, e2, , en
- Note the elementary events cannot be further
divided into smaller events. - e.g. flip a coin twice, how many elementary
events you expect to observe? - getting one head one tail is NOT an elementary
event. - Elementary events are HH, HT, TH, TT
5
Description of Events
- Sample Space
- Collection of all elementary outcomes
- In many experiments, identifying sample space is
important. - Write down the sample space of the following
experiments - throwing a pair of dice.
- flipping a coin three times.
- drawing two cards from a bridge deck.
- An event (denoted as E), can be represented as a
combination of elementary events. - E.g. E A die shows number higher than 3
- Elementary events e1 e2 e3
.
6
Rules of Assigning Probabilities
- Three rules are commonly used
- Classical Probability Assessment
- Relative Frequency Assessment
- Subjective Probability Assessment
7
Basic Rules to assign probability (1)
- Classical probability Assessment
- Exercise
- Decide the probability of the following events
- Get a card higher than 10 from a bridge deck
- Get a sum higher than 11 from throwing a pair of
dice. - John and Mike both randomly pick a number from
1-5, what is the chance that these two numbers
are the same?
Number of Elementary Events Total number of
Elementary Events
P(E)
- where
- E refers to a certain event.
- P(E) represents the probability of the event E
When to use this rule? When the chance of each
elementary event is the same e.g. cards, coins,
dices, use random number generator to select a
sample
8
Basic Rules to assign probability (2)
- Relative Frequency of Occurrence
- Examples
- If a survey result says, among 1000 people, 600
prefer iphone to ipod touch, then you assign the
probability that the next person you meet will
like iphone is 60. - A basketball players percentage of made free
throws. Why do you think Yao Ming has a better
chance to win the free throw competition than
Shaq ONeal? - The probability that a TV is sent back for
repair? Based on past experience. - The most commonly used in the business world.
9
Exercise
- A clerk recorded the number of patients waiting
for service at 900am on 20 successive days
Assign the probability that there are at most 2
agents waiting at 900am.
Number of waiting Number of Days Outcome Occurs
0 2
1 5
2 6
3 4
4 3
Total 20
10
Exercise 4.1 (Page 137)
Male Female
Under 20 168 208
20 to 40 340 290
Over 40 170 160
Elementary Events? Sample Space? a) Probability
that a customer is a male? b) Probability that
a customer is 20 to 40 years old? c)
Probability that a customer being 20 to 40 years
old and a male?
11
Basic Rules to assign probability (3)
- Subjective Probability Assessment
- Subjective probability assessment has to be used
when there is not enough information for past
experience. - Example1 The probability a player will make the
last minute shot (a complicated decision process,
contingent on the decision by the component
teams coach, the players feeling, etc.) - Example2 Deciding the probability that you can
get the job after the interview. - Smile of the interviewer
- Whether you answer the question smoothly
- Whether you show enough interest of the position
- How many people you know are competing with you
- Etc.
- Always try to use as much information as
possible. - As the world is changing dramatically, people
are more and more rely upon subjective
assessment.
12
Summary of Basic Approaches
- Classical Rule
- Elementary events have equal odds
- Relative Frequency
- Use relative frequency table. Probability
assigned based on percentage of occurrence. - Subjective
- Based on experience, combining different signals
to make inference. No standard approach to have
people agree on each other. - No matter what method used, probability cannot
be higher than 1 or lower than 0!
13
Rules for complement events
- what is the a complement event?
- The Rule
E
E
If Obamas chance of winning the presidential
campaign is assigned to be 60, that means
McCains chance is 1-60 40.
If the probability that at most two patients are
waiting in the line is 0.65, what is the
complement event? And what is the probability?
14
Composite Events
- E E1 and E2
- (E1 is observed) AND (E2 is also observed)
- E E1 or E2
- Either (E1 is observed) Or (E2 is
observed) - More specifically, P(E1 or E2) P(E1) P(E2) -
P(E1 and E2)
E1
E2
P(E1 and E2) P(E1) P(E1 and E2) P(E2)
P(E1 and E2)
E1
E2
P(E1 or E2) P(E1) P(E1 or E2) P(E2)
15
Exercise
Male Female Total
Under 20 168 208 376
20 to 40 340 290 630
Over 40 170 160 330
Total 678 658 1336
- What is the probability of selecting a person who
is a male? - What is the probability of selecting a person who
is under 20? - What is the probability of selecting a person who
is a male and also under 20? - What is the probability of selecting a person who
is either a male or under 20?
16
Mutually Exclusive Events
- If two events cannot happen simultaneously, then
these two events are called mutually exclusive
events. - Ways to determine whether two events are mutually
exclusive - If one happens, then the other cannot happen.
- Examples
- Draw a card, E1 A Red card, E2 A card of club
- Throwing a pair of dice, E1 one die shows
- E2 a double six.
- All elementary events are
- mutually exclusive.
- Complement Events
E2
E1
17
Rules for mutually exclusive events
- If E1 and E2 are mutually exclusive, then
- P(E1 and E2) ?
- P(E1 or E2) ?
- Exercise
- Throwing a pair of dice, what is the probability
that I get a sum higher than 10? - E1 getting 11
- E2 getting 12
- E1 and E2 are mutually exclusive.
- So P(E1 or E2) P(E1) P(E2)
E2
E1
18
Conditional Probabilities
- Information reveals gradually, your estimation
changes as you know more. - Draw a card from bridge deck (52 cards).
Probability of a spade card? - Now, I took a peek, the card is black, what is
the probability of a spade card? - If I know the card is red, what is the
probability of a spade card? - What is the probability of E1?
- What if I know E2 happens, would you
- change your estimation?
E1
E2
19
Bayes Theorem
- Conditional Probability Rule
- Example
- P(Male)? P(GPA ?3.0)?
- P(Male and GPAlt3.0)? P(Female and GPA
?3.0)? - P(GPAlt3.0 Male) ? P (Female GPA
?3.0)?
Thomas Bayes (1702-1761)
GPA?3.0 GPAlt3.0
Male 282 323
Female 305 318
20
Independent Events
- If
- then we say that Events E1 and E2 are
independent. - That is, the outcome of E1 is not affected by
whether E2 occurs. - Typical Example of independent Events
- Throwing a pair of dice, the number showed on
one die and the number on the other die. - Toss a coin many times, the outcome of each time
is independent to the other times.
How to prove?
20
21
Exercise
- Calculate the following probabilities
- Prob of getting 3 heads in a row?
- Prob of a double-six?
- Prob of getting a spade card which is also higher
than 10? - Data shown from the following table. Decide
whether the following events are independent? - Selecting a male versus selecting a female?
- Selecting a male versus selecting a person
under 20?
Male Female
Under 20 168 208
20 to 40 340 290
Over 40 170 160
22
Probability Distribution
- Random Variable
- A variable with random (unknown) value.
Examples
1. Roll a die twice Let x be the number of
times 4 comes up. x 0, 1, or 2
2. Toss a coin 5 times Let x be the number of
heads x 0, 1, 2, 3, 4, or 5
3. Same as experiment 2 Lets say you pay your
friend 1 every time head shows up, and he pays
you 1 otherwise. Let x be amount of money you
gain from the game. What are the possible
values of x?
23
Discrete vs. Continuous Random variables
Random Variables
Continuous
Discrete
Examples
Examples
Number of students showed up next time
The temperature tomorrow
Number of late apt. rental payments in Oct.
The total rental payment collected by Sep 30
Your score in this coming mid-term exam
The expected lifetime of a new light bulb
24
Discrete Probability Distribution
X P(X)
0 0.25
1 0.5
2 0.25
Table
All the possible values of x
- Two ways to represent discrete probability
distributions
Probability
Graph
25
Exercise
- Describe the probability distribution of the
random variables - Draw a pair of dice, x is the random variable
representing the sum of the total points. - Step 1 Write down all the possible values in
left column - Step 1.1 Write down the sample space
- Step 2 Write down the corresponding
probabilities
26
Measures of Discrete Random Variables
Example What is your expected gain when you
play the flip-coin game twice?
- Expected value of a discrete distribution
- An weighted average, taking into account the
probability - The expected value of random variable x is
denoted as E(x)
E(x) ?xi P(xi) E(x) x1P(x1) x2P(x2)
xnP(xn)
E(x) (-2) 0.25 0 0.5 2 0.25
0
Your expected gain is 0! a fair game.
27
Spreadsheet to compute the expected value
- Step1 develop the distribution table according
to the description of the problem. - Step2 add one (3rd) column to compute the
product of the value and the probability - Step3 compute the sum of the 3rd column ? The
Expected Value
x P(x) xP(x)
-2 0.25 -2.25-0.5
0 0.5 00.50
2 0.25 20.250.5
E(x) -0.500.50
28
Exercise
- You are working part time in a restaurant. The
amount of tip you get each time varies. Your
estimation of the probability is as follows - You bargain with the boss saying you want a more
fixed income. He said he can give you 62 per
night, instead of letting you keep the tips.
Would you want to accept this offer?
per night Probability
50 0.2
60 0.3
70 0.4
80 0.1
29
More Exercise
- Buy lottery price 10
- With 0.0000001 chance, you can win 1million
- With 0.001 chance, you can win 1000
- With 0.1 chance, you can win 50
- What is the expected gain of buying this lottery
ticket? - Is buying lottery a fair game?
30
Rule for expected value
- If there are two random variables, x and y. Then
- E(xy) E(x) E(y)
- Example Head -2, Tail 1
- x is your gain from playing the game the first
time - y is your gain from playing the game the second
time - xy is your total gain from playing the two games.
Write down the probability distribution of xy
and calculate the expected value for xy
x P(x)
-2 0.5
1 0.5
y P(y)
-2 0.5
1 0.5
E(y) -0.5
E(x) -0.5
Is this game a fair game?
31
Exercise
- Assume that the expected payoff of playing the
slot machine is -0.04 cents - What is the expected payoff when playing 100
times? 10,000 times?
32
Measure of risk-- variance
- Two games
- Flip a coin once, if head then you get 1,
otherwise you pay 1 - Flip a coin once, if head then you get 100,
otherwise you pay 100 - Which game will you choose?
- Three basic types of people
- Risk-lover
- Risk-neutral
- Risk-averse
What is your type?
33
Measures variance
Step 1 develop the probability distribution
table. Step 2 compute the mean E(x)
50x0.260x0.370x0.480x0.164 Step 3 compute
the distance from the mean for each value
(x-E(x)) Step 4 square each distance (x
E(x))2 Step 5 weight the squared distance
(x-E(x))2P(x) Step 6 sum up all the weighted
square distance ? variance
- Variance a weighted average of the squared
deviation from the expected value.
x P(x) x E(x) (x-E(x))2 (x-E(x))2P(x)
50 0.2 50-64-14 (-14)2196 1960.239.6
60 0.3 -4 16 4.8
70 0.4 6 36 14.4
80 0.1 16 256 25.6
84.4 (sum of above)
34
Variance and Standard deviation
- Variance
- The variance of a random variable has the same
meaning as the variance of population - Calculation is the same as calculating population
variance using a relative frequency table. - Written as var(x) or
- Standard deviation of a random variable
- Same of the population standard deviation
- Calculate the variance
- Then take the square root of the variance.
- Written as sd(x) or
- e.g. for the example on page 10
35
More exercise
- Page 4.66
Recommended
CrystalGraphics Presentations


