
Hurricane Katrina, Aug. 28, 2005, 1515Z (10:15 a.m. CDT) - PowerPoint PPT Presentation
Title:
Hurricane Katrina, Aug. 28, 2005, 1515Z (10:15 a.m. CDT)
Description:
Mapping Hurricanes Working with Digital Vector and Raster Data Sets Presented by Scott White (white_s_at_fortlewis.edu) Department of Geosciences, Fort Lewis College ... – PowerPoint PPT presentation
Number of Views:107
Avg rating:3.0/5.0
Title: Hurricane Katrina, Aug. 28, 2005, 1515Z (10:15 a.m. CDT)
1
Mapping Hurricanes Working with Digital Vector
and Raster Data Sets
Presented by Scott White (white_s_at_fortlewis.edu) D
epartment of Geosciences, Fort Lewis College,
Durango, Colorado Cutting Edge Workshop Using
GIS and Remote Sensing to Teach Geoscience in the
21st Century Montana State University,
Bozeman August 8-11, 2010
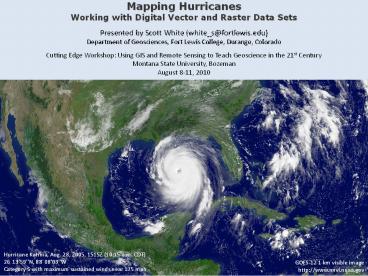
Hurricane Katrina, Aug. 28, 2005, 1515Z (1015
a.m. CDT) 2613'59''N, 8808'03''W Category 5
with maximum sustained winds near 175 mph
GOES-12 1 km visible image http//www.nnvl.noaa.go
v
2
- Fort Lewis College GIS Program
- FLC is a public liberal arts college with
located in Durango, Colorado about 3,400
undergrads - GIS is housed in the Geosciences Dept.
- GIS Certificate (incl. 4 GIS/RS courses)
- primarily Science students (Bio/Geo/Anthro), all
levels - ArcGIS (ArcInfo) campus site license
3
Mapping Hurricanes Working with Digital Vector
and Raster Data Sets
- Outline
- Objectives of the GIS Exercises
- Exercise 1 Creating a Regional Base Map
- Focus on creating a basic map of the region
affected by a recent hurricane and/or tropical
storm - Use of ESRI map data
- Symbology, labeling, and the map layout
- Exercise 2 Creating a Regional Thematic Map
- Focus on creating a hurricane-related thematic
map from the Exercise 1 base map - Mapping Hurricane Katrina Designated Disaster
Areas using FEMA data - Symbology, labeling, and the map layout
- Exercise 3 Creating Hurricane and Tropical
Storm Maps - Map 1 Focus on creating a map showing a
hurricane/tropical storm track with positions of
the storm and hurricane/tropical storm force
wind swaths - Building a spreadsheet of hurricane/tropical
storm data using NOAA NHC data - Point features (hurricane/tropical storm
locations) and polyline feature (storm track) - Symbology, labeling, and the map layout
- Map 2 Focus on creating a map showing the
position of a satellite image relative to the
base map
4
Mapping Hurricanes Working with Digital Vector
and Raster Data Sets
- Outline
- Objectives of the GIS Exercises
- Exercise 1 Creating a Regional Base Map
- Focus on creating a basic map of the region
affected by a recent hurricane and/or tropical
storm - Use of ESRI map data
- Symbology, labeling, and the map layout
- Exercise 2 Creating a Regional Thematic Map
- Focus on creating a hurricane-related thematic
map from the Exercise 1 base map - Mapping Hurricane Katrina Designated Disaster
Areas using FEMA data - Symbology, labeling, and the map layout
- Exercise 3 Creating Hurricane and Tropical
Storm Maps - Map 1 Focus on creating a map showing a
hurricane/tropical storm track with positions of
the storm and hurricane/tropical storm force
wind swaths - Building a spreadsheet of hurricane/tropical
storm data using NOAA NHC data - Point features (hurricane/tropical storm
locations) and polyline feature (storm track) - Symbology, labeling, and the map layout
- Map 2 Focus on creating a map showing the
position of a satellite image relative to the
base map
5
Mapping Hurricanes Working with Digital Vector
and Raster Data Sets
- Outline
- Objectives of the GIS Exercises
- Exercise 1 Creating a Regional Base Map
- Focus on creating a basic map of the region
affected by a recent hurricane and/or tropical
storm - Use of ESRI map data
- Symbology, labeling, and the map layout
- Exercise 2 Creating a Regional Thematic Map
- Focus on creating a hurricane-related thematic
map from the Exercise 1 base map - Mapping Hurricane Katrina Designated Disaster
Areas using FEMA data - Symbology, labeling, and the map layout
- Exercise 3 Creating Hurricane and Tropical
Storm Maps - Map 1 Focus on creating a map showing a
hurricane/tropical storm track with positions of
the storm and hurricane/tropical storm force
wind swaths - Building a spreadsheet of hurricane/tropical
storm data using NOAA NHC data - Point features (hurricane/tropical storm
locations) and polyline feature (storm track) - Symbology, labeling, and the map layout
- Map 2 Focus on creating a map showing the
position of a satellite image relative to the
base map
6
(No Transcript)
7
Mapping Hurricanes Working with Digital Vector
and Raster Data Sets
- Outline
- Objectives of the GIS Exercises
- Exercise 1 Creating a Regional Base Map
- Focus on creating a basic map of the region
affected by a recent hurricane and/or tropical
storm - Use of ESRI map data
- Symbology, labeling, and the map layout
- Exercise 2 Creating a Regional Thematic Map
- Focus on creating a hurricane-related thematic
map from the Exercise 1 base map - Mapping Hurricane Katrina Designated Disaster
Areas using FEMA data - Symbology, labeling, and the map layout
- Exercise 3 Creating Hurricane and Tropical
Storm Maps - Map 1 Focus on creating a map showing a
hurricane/tropical storm track with positions of
the storm and hurricane/tropical storm force
wind swaths - Building a spreadsheet of hurricane/tropical
storm data using NOAA NHC data - Point features (hurricane/tropical storm
locations) and polyline feature (storm track) - Symbology, labeling, and the map layout
- Map 2 Focus on creating a map showing the
position of a satellite image relative to the
base map
8
(No Transcript)
9
(No Transcript)
10
(No Transcript)
11
Mapping Hurricanes Working with Digital Vector
and Raster Data Sets
- Outline
- Objectives of the GIS Exercises
- Exercise 1 Creating a Regional Base Map
- Focus on creating a basic map of the region
affected by a recent hurricane and/or tropical
storm - Use of ESRI map data
- Symbology, labeling, and the map layout
- Exercise 2 Creating a Regional Thematic Map
- Focus on creating a hurricane-related thematic
map from the Exercise 1 base map - Mapping Hurricane Katrina Designated Disaster
Areas using FEMA data - Symbology, labeling, and the map layout
- Exercise 3 Creating Hurricane and Tropical
Storm Maps - Map 1 Focus on creating a map showing a
hurricane/tropical storm track with positions of
the storm and hurricane/tropical storm force
wind swaths - Building a spreadsheet of hurricane/tropical
storm data using NOAA NHC data - Point features (hurricane/tropical storm
locations) and polyline feature (storm track) - Symbology, labeling, and the map layout
- Map 2 Focus on creating a map showing the
position of a satellite image relative to the
base map
12
(No Transcript)
13
(No Transcript)
14
(No Transcript)
15
(No Transcript)
16
(No Transcript)
17
Mapping Hurricanes Working with Digital Vector
and Raster Data Sets
- Outline
- Objectives of the GIS Exercises
- Exercise 1 Creating a Regional Base Map
- Focus on creating a basic map of the region
affected by a recent hurricane and/or tropical
storm - Use of ESRI map data
- Symbology, labeling, and the map layout
- Exercise 2 Creating a Regional Thematic Map
- Focus on creating a hurricane-related thematic
map from the Exercise 1 base map - Mapping Hurricane Katrina Designated Disaster
Areas using FEMA data - Symbology, labeling, and the map layout
- Exercise 3 Creating Hurricane and Tropical
Storm Maps - Map 1 Focus on creating a map showing a
hurricane/tropical storm track with positions of
the storm and hurricane/tropical storm force
wind swaths - Building a spreadsheet of hurricane/tropical
storm data using NOAA NHC data - Point features (hurricane/tropical storm
locations) and polyline feature (storm track) - Symbology, labeling, and the map layout
- Map 2 Focus on creating a map showing the
position of a satellite image relative to the
base map
18
Mapping Hurricanes Working with Digital Vector
and Raster Data Sets
Data sources and websites ESRI Data Maps (DVD
included with ArcGIS products)
http//www.esri.com/data/data-maps/index.html
FEMA Mapping and Analysis Center Hurricane
Katrina Declared Disasters http//www.gismaps.
fema.gov/2005pages/katrina.shtm NOAA NHC
Hurricane Katrina Advisory Archive http//www.
nhc.noaa.gov/archive/2005/KATRINA.shtml NASA
MODIS Rapid Response Gallery http//rapidfire.
sci.gsfc.nasa.gov/gallery
19
Mapping Hurricanes Working with Digital Vector
and Raster Data Sets
Recommended
CrystalGraphics Presentations


