
Predicting GPM Signals with the GPM Satellite Simulator - PowerPoint PPT Presentation
1 / 6
Title:
Predicting GPM Signals with the GPM Satellite Simulator
Description:
Name: Toshi Matsui, NASA/GSFC, Code 612 E-mail: Toshihisa.Matsui-1_at_nasa.gov Phone: 301-614-5658 – PowerPoint PPT presentation
Number of Views:62
Avg rating:3.0/5.0
Title: Predicting GPM Signals with the GPM Satellite Simulator
1
Predicting GPM Signals with the GPM Satellite
Simulator Toshi Matsui, Code 612, NASA GSFC and
ESSIC-UMD
- The Global Precipitation Measurement (GPM) Core
satellite plays a central role in the GPM mission
by calibrating the precipitation algorithms of
the GPM Constellation satellites. Before its
launch (Feb 2014), first generation GPM Core
precipitation algorithms must be established,
particularly for areas outside the current TRMM
range. - To support Core precipitation algorithm
development, the Synthetic GPM Satellite
Simulator integrates GPM Ground Validation
(GV) observations, regional high-resolution storm
simulations from cloud-resolving models, and GPM
instrument simulators (forward modeling). - GV in-situ observations are used to constrain the
storm simulations, which are used to predict
GPM-observable signals through the unified GPM
simulator. - The simulated GPM orbital testbeds are used to
diagnose the performance of pre-launch
precipitation algorithms for the upcoming launch
of the GPM Core Observatory.
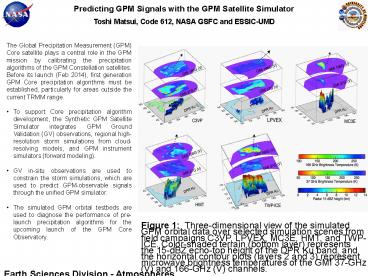
Figure 1 Three-dimensional view of the
simulated GPM orbital data over selected
simulation scenes from field campaigns C3VP,
LPVEX, MC3E, HMT, and TWP-ICE. Color-shaded
terrain (bottom layer) represents the 15-dBZ
echo-top height of the DPR Ku band, and the
horizontal contour plots (layers 2 and 3)
represent microwave brightness temperatures of
the GMI 37-GHz (V) and 166-GHz (V) channels.
Earth Sciences Division - Atmospheres
2
Name Toshi Matsui,
NASA/GSFC, Code 612 ltESSIC UMDgt
E-mail Toshihisa.Matsui-1_at_nasa.gov
Phone 301-614-5658 References
Matsui, T. T. Iguchi, X. Li, M. Han, W.-K. Tao,
W. Petersen, T. LEcuyer, R. Meneghini, W. Olson,
C. D. Kummerow, A. Y. Hou, M. R. Schwaller, E. F.
Stocker, J. Kwiatkowski, 2013 GPM satellite
simulator over ground validation sites, Bulletin
of the American Meteorological Society, in press,
early o-line release at doi http//dx.doi.org/10.
1175/BAMS-D-12-00160.1 Data Sources The GPM
Ground Validation (GV) program recently conducted
a series of field campaigns in mid- and
high-latitude regions over Ontario, Canada
Canadian CloudSat/CALIPSO Validation Project
(C3VP) and the GPM Cold-season Precipitation
Experiment (GCPEx) Helsinki, Finland Light
Precipitation Validation Experiment (LPVEx),
LEcuyer et al. (2010) and Oklahoma
Midlatitude Continental Convective Clouds
Experiment (MC3E) to study a variety of
precipitation processes. Observations from
ground- and aircraft-based in-situ and remote
sensing data are used to evaluate macro- and
micro-structure of cloud-precipitation processes
in model simulations of these weather
systems/storms. The high-resolution simulations
were conducted using the Weather Research and
Forecasting (WRF) model with spectral bin
microphysics (WRF-SBM, Iguchi et al. 2012, 2013)
and the forward modeling from the Goddard
Satellite Data Simulator Unit (G-SDSU, Matsui et
al 2009). Technical Description of
Figures Figure 1 Figures displays simulated GMI
Tb and Dual Polarization Radar (DPR) reflectivity
from a selected scene of each GV site. The
simulated GPM satellite signals associated with
the different precipitating systems depicted have
broad spectra. However, the signal database is
limited to the WRF-SBM domain instead of an
entire orbit. The simulated orbital data include
detailed, retrieval-like geophysical parameters,
such as rainfall rate, column water vapor,
surface skin temperature, and moments of
precipitation PSDs derived from the WRF-SBM.
These geophysical parameters are then processed
in the forward modeling with the same antenna
convolution method in the GMI and DPR modules.
Thus, the satellite sensor-observable signals and
algorithm-retrievable geophysical parameters are
sampled in identical footprints within the same
dataset, allowing algorithm scientists to quickly
assess their retrieval algorithm products.
Scientific significance The Synthetic GPM
Simulator utilizes a comprehensive regional storm
model with detailed microphysics, constrained by
the best possible in-situ and aircraft
measurements from the GPM GV field campaigns.
Both precipitation process studies and the first
generation of GPM Core Satellite precipitation
algorithms are resulting from this unique
combination of data and models. Relevance for
Future Missions Global Precipitation Measurement
(GPM) mission will detect rainfall rate globally
approximately every three hours using an
international constellation of satellites. The
Synthetic GPM Simulator can be initially utilized
for constructing virtual algorithm testbeds.
After the launch of the GPM core satellite, this
software can be also used for data assimilation
or radiance-based evaluation in
cloud-precipitation process of mesoscale
atmospheric models.
Earth Sciences Division - Atmospheres
3
New MODIS 3 km product provides insight about
urban aerosol retrieval biases Leigh Munchak,
Robert Levy, Shana Mattoo, Joel Schafer, NASA GSFC
July 1st, 2011 3 km
July 21st, 2011 3 km
The MODIS instruments aboard the Terra and Aqua
satellites have provided a rich dataset of
aerosol information at a 10 km spatial scale.
Although originally intended for climate
applications, the air quality community is also
using the MODIS aerosol data. However, 10 km
resolution is not sufficient to resolve local
scale aerosol features. With this in mind, MODIS
Collection 6 (Levy et al., 2013) is including a
global aerosol product with a 3 km resolution
(Remer et al., 2013). Here, we evaluate the 3 km
product over the Baltimore/Washington D.C., USA
corridor during the summer of 2011 by comparing
with a temporary network of 44 AERONET sun
photometers spaced 10 km apart, as part of
NASAs DISCOVER-AQ field campaign
(www.nasa.gov/mission_pages/discover-aq/). Figure
1 (left) shows excellent agreement between MODIS
and AERONET AOD at sites outside the urban areas,
but Figure 1 (right) shows an overestimation of
AOD in urban areas. In order to study this
further, we separate the 3 km MODIS/AERONET
collocations by AERONET station, and compute
agreement statistics for each station. Figure 2
(left) shows remarkable variability in the
percent of collocations within expected error
(EE, 0.05.15AOD) for each station, ranging
between 16 to 95. The stations with the
smallest percent within EE are clustered around
the Baltimore urban center, and the more
urbanized I-95 corridor between Washington D.C.
and Baltimore. Figure 2 (right) shows that there
is a strong relationship between the
overestimation of AOD at an AERONET site and how
much urban surface is near the AERONET site
location.
AOD at 0.55 µm
Figure 1 MODIS AOD at 3 km resolution for two
days, 7/21/2011 (left) and 7/01/2011 (right).
Circles represent MODIS/AERONET collocation
statistics, the inner circle being the temporal
average (30 minutes) from AERONET, and the
outside circle being the spatial average (5 x 5
pixel box) from MODIS. The cities of Washington
and Baltimore are plotted as black stars.
of collocations above EE
within EE
Urban percentage
Figure 2 (Left) Percent of 3 km MODIS/AERONET
0.55 µm AOD collocations that MODIS retrieves AOD
within expected error (0.05.15AOD). Urban
landcover, identified by the MODIS land product,
is shown in grey. (Right) Percent of the
collocations where the MODIS AOD exceeds the
expected error, compared to the percentage of the
5x5 box which is urban.
Earth Sciences Division - Atmospheres
4
Name Leigh Munchak, Robert Levy, Shana Mattoo,
Joel Schafer E-mail leigh.a.munchak_at_nasa.gov,
robert.c.levy_at_nasa.gov, shana.mattoo-1_at_nasa.gov,
joel.s.schafer_at_nasa.gov Phone
301-614-5835 References Munchak et al. (2013),
MODIS 3 km aerosol product applications over
land in an urban/suburban region, Atmos. Meas.
Tech. Discuss., 6, 1683-1716, doi10.5194/amtd-6-1
683-2013. Remer et al. (2013), MODIS 3 km aerosol
product algorithm and global perspective, Atmos.
Meas. Tech. Discuss., 6, 69-112,
doi10.5194/amtd-6-69-2013 Levy et al., (2013),
The Collection 6 MODIS aerosol products over land
and ocean, Atmos. Meas. Tech. Discuss., 6,
159-259, doi10.5194/amtd-6-159-2013. Data
Sources MODIS Level 1B data, MODIS Collection 6
aerosol products (MxD04_L2 and MxD04_3K), MODIS
land cover product (MCD12Q1), AERONET
data Technical Description of Figures Figure
1 MODIS AOD at 3 km resolution for two days,
7/21/2011 (left) and 7/01/2011 (right).
MODIS/AERONET collocations are plotted in the
circles, the inner circle being the AERONET
temporally averaged AOD, and the outside circle
being the spatial average of the MODIS AOD in a
5x5 pixel box around the AERONET station. Only
land pixels with a QA 3 are used in the
collocations. Washington D.C. is shown with the
large black star and Baltimore, MD is shown with
the small black star. The true color image,
created from the MODIS red, green and blue bands,
is shown in the background. Figure 2 (Left)
Percent of 3 km MODIS/AERONET collocations of
0.55 µm AOD within expected error (0.05.15AOD)
at each AERONET station. Land identified as
urban/built up by the MODIS land cover product
(MCD12Q1) is plotted in grey. (Right) Percent of
3 km MODIS/AERONET 0.55 µm AOD collocations above
expected error (0.05.15AOD) at each AERONET
station, plotted against the percentage of pixels
within the 15 km by 15 km collocation box
identified as urban by the MODIS land cover
product. Scientific significance Routinely
monitoring urban air quality remains a challenge,
particularly in the developing world where
in-situ measurements are sparse or non-existent.
Satellite measurements of aerosols have shown
promise to supplement monitoring networks
however, the relatively coarse scale of AOD
measurements does not adequately resolve small
scale sources of pollution. The MODIS 3 km
product is a large step forward towards matching
the scale of observations to the scale needed to
measure aerosols for air quality applications.
However, there is evidence that a significant
source of bias observed in the 3 km product
results from improper characterization of urban
surfaces. The poor performance of the 3 km
product over urban surfaces is clearly a
limitation in terms of air quality applications.
How to best address this problem in an
operational environment remains an open question.
Relevance for future science Better
characterizing surface reflectance would improve
aerosol retrievals over much of the world,
including in urban areas and over moderately
vegetated brighter surfaces. Although the MODIS
sensor is an aging instrument, the VIIRS
instrument aboard NPP and slated for launch on
JPSS1 and JPSS2 can employ an algorithm that is
very similar to MODIS to retrieve aerosols. This
provides an excellent opportunity for creating
long term data records, and monitoring change in
aerosol over urban regions.
Earth Sciences Division - Atmospheres
5
A Long-Term Data Set of Ozone Measurements from
SpaceGordon Labow, Richard McPeters, Code 614,
NASA GSFC
Total column ozone and ozone profile data from
the Nimbus-4 Backscatter UltraViolet (BUV)
instrument, Nimbus-7 Solar Backscatter
Ultraviolet (SBUV) instrument, as well as from
seven NOAA SBUV/2 instruments have been newly
reprocessed with the Version 8.6 ozone retrieval
algorithm. This yields a coherent data set with
no data gaps or time periods with large
uncertainties due to calibration issues from 1979
to the present. The data from 1970-1975 are
included to give an unprecedented time series of
over 40 years of ozone measurements from space.
Comparisons to ground-based ozone measurements
(Figure 1) show that the satellite retrievals are
of high quality. The annual mean time series
comparisons to an ensemble of ground stations
show an agreement within 1 over for almost the
whole time period with the bias approaching zero
over the last decade. The aerosols associated
with Mt Pinatubo caused an underestimation of
ozone in 1992 from the NOAA-9 SBUV/2
instrument. Figure 2 shows that ozone has
decreased by about 5 over the past 40 years,
with most of the decrease occurring in the
1980s. This time series provides the best
existing data for trend analysis and model
validation. A careful multivariate analysis is
being carried out to accurately determine
long-term ozone trends and to separate the
processes impacting the trends.
(a)
(b)
Figure 1 A comparison of all the BUV SBUV
instruments (processed with Version 8.6
algorithm) to an ensemble of 33 Northern
Hemisphere Ground Stations. The agreement is
within /- 1 for almost the entire data record.
Figure 2 Global ozone trends (65N to 65S).
difference from 1979/1980 showing the long-term
decrease in total column ozone.
Earth Sciences Division - Atmospheres
6
Name Gordon Labow,
SSAI NASA/GSFC, Code 614
E-mail gordon.j.labow_at_nasa.gov
Phone 301-614-6040 References Gordon
J. Labow, Richard D. McPeters, Pawan K. Bhartia
and Natalya Kramarova A comparison of 40 years of
SBUV measurements of column ozone with data from
the Dobson/Brewer network JOURNAL OF GEOPHYSICAL
RESEARCH ATMOSPHERES, VOL. 118, 1 9,
doi10.1002/jgrd.50503, 2013 Kramarova, N. A.,
Frith, S. M., Bhartia, P. K., McPeters, R. D.,
Taylor, S. L., Fisher, B. L., Labow, G. J., and
DeLand, M. T. Validation of ozone monthly zonal
mean profiles obtained from the version 8.6 Solar
Backscatter Ultraviolet algorithm, Atmos. Chem.
Phys., 13, 6887-6905, doi10.5194/acp-13-6887-2013
, 2013. Data Sources The BUV, SBUV and SBUV/2
overpass ozone data are publicly available at
ftp//jwocky.gsfc.nasa.gov/pub/sbuv All
ground-based ozone data were taken (and are
currently available) from the WOUDC in Downsview,
Canada. Technical Description of Figures Figure
1 33 Different Northern Hemisphere Dobson
and/or Brewer stations were used in this
comparison. The Nimbus-4 BUV data (1970-1976) has
more uncertainty associated with it and the
satellite calibration is not known as well as the
later instruments. The ground-based data is also
not of the same quality as the post 1980 data.
The aerosols associated with Mt Pinatubo caused a
slight underestimation of ozone from the NOAA-9
instrument because it was in an early morning
equator crossing time orbit. NOAA-11s orbit was
much closer to noon and did not have the same
problem because its view geometry was much
better. The small trend in the differences seen
from 1993-2003 is not currently understood.
Figure 2 The average monthly ozone percent
difference in total column ozone from the
1979/1980 average. The percent difference plot
removes the large annual variation to reveal
small long term changes. Most of the ozone
decrease occurred in the 1980s and early 1990s
and has leveled off since. As this data set is
continued into the future, the recovery of the
ozone layer should become evident. Scientific
significance The ozone time series derived from
satellites can now be used as far back as 1970.
These data can now be used for model testing and
for global long-term ozone trend analysis. It can
also be used to assess the quality of individual
ground instruments. Ozone depleting substances
(ODS) have been banned from production by the
Montreal Protocol (1989) and the ozone layer is
predicted to recover to pre-industrial levels by
2050. A long term, highly accurate series of
measurements from space is important in order to
establish a baseline to detect the recovery of
the ozone layer and confirm model
predictions. Relevance for Future Missions
Data from the operational SBUV/2 instruments will
be added to the existing ozone data record which
will allow continued monitoring of the state of
the ozone layer. Ozone recovery due to
decreasing ODS emissions is predicted to take
decades and monitoring the this recovery is
critical to our understanding of the atmosphere.
The recently launched Suomi National
Polar-orbiting Partnership (NPP) mission is
continuing NASAs 40 year monitoring of the
ozone layer. NPP is the result of a partnership
between NASA, the National Oceanic and
Atmospheric Administration, and the Department of
Defense. Future missions such as the Joint Polar
Satellite System (JPSS) is the next generation
polar-orbiting operational environmental
satellite system which will carry ozone
measurements well into the future.
Laboratory for Atmospheres
Recommended
CrystalGraphics Presentations


